Disclaimer: The information presented does not constitute financial, investment, trading, or other types of advice and is solely the writer’s opinion.
- The 1-day and 1-hour timeframe price charts showed that XRP bulls were dominant.
- A dip to the $0.78 demand zone is likely to result in a higher rally.
Ripple [XRP] has been one of July’s standout performers in the crypto market. The Ripple lawsuit saw the judge rule that XRP was not a security, which sparked a remarkable rally on 13 July.
Realistic or not, here’s XRP’s market cap in BTC’s terms
The higher timeframe price chart favored the bulls. Further gains toward the $1.04 level or higher were possible, although there was the possibility of a deep pullback. Yet over the past week, buyers have succeeded in driving prices above $0.8. Can traders expect further upside?
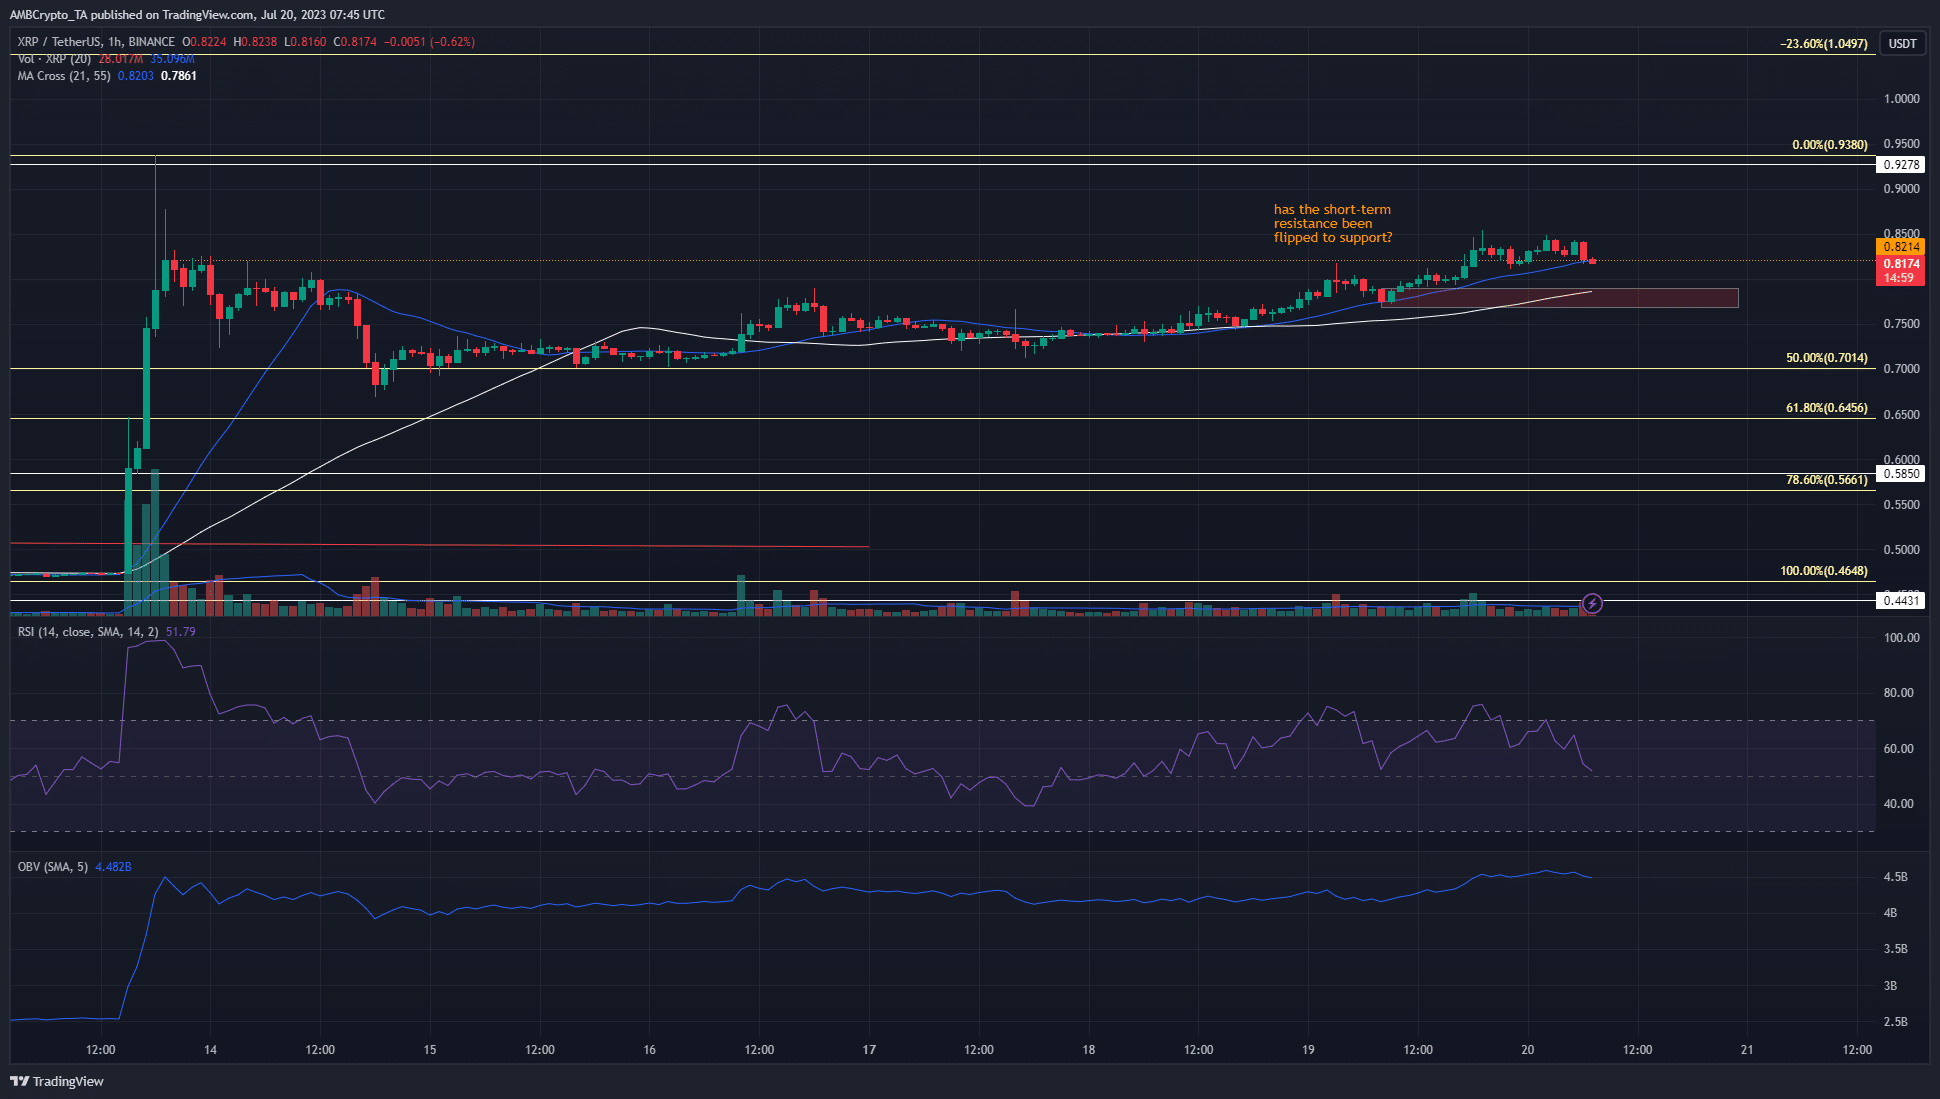
XRP’s short-term momentum showed signs of weakening
The market structure has been bullish since 17 June, when XRP was trading at $0.715. Since then, buyers have forced prices higher and established an uptrend on lower timeframes. The 1-hour chart showed that there were two regions where XRP can find demand.
The first was the support level at $0.82 that had acted as resistance on 13 July. This level was briefly flipped to support in the past few hours but it seemed the bears could drive the bulls back a bit. The next support zone was the bullish order block at $0.0782, marked in red. It has confluence with the 55-period SMA and a move below this region would flip the structure bearishly.
Go to Source to See Full Article
Author: Akashnath S
Tip BTC Newswire with Cryptocurrency
Donate Bitcoin to BTC Newswire

Donate Bitcoin Cash to BTC Newswire

Donate Ethereum to BTC Newswire

Donate Litecoin to BTC Newswire

Donate Monero to BTC Newswire

Donate ZCash to BTC Newswire


