Disclaimer: The information presented does not constitute financial, investment, trading, or other types of advice and is solely the writer’s opinion.
- The one-hour timeframe market structure was bullish, but the daily timeframe was bearish.
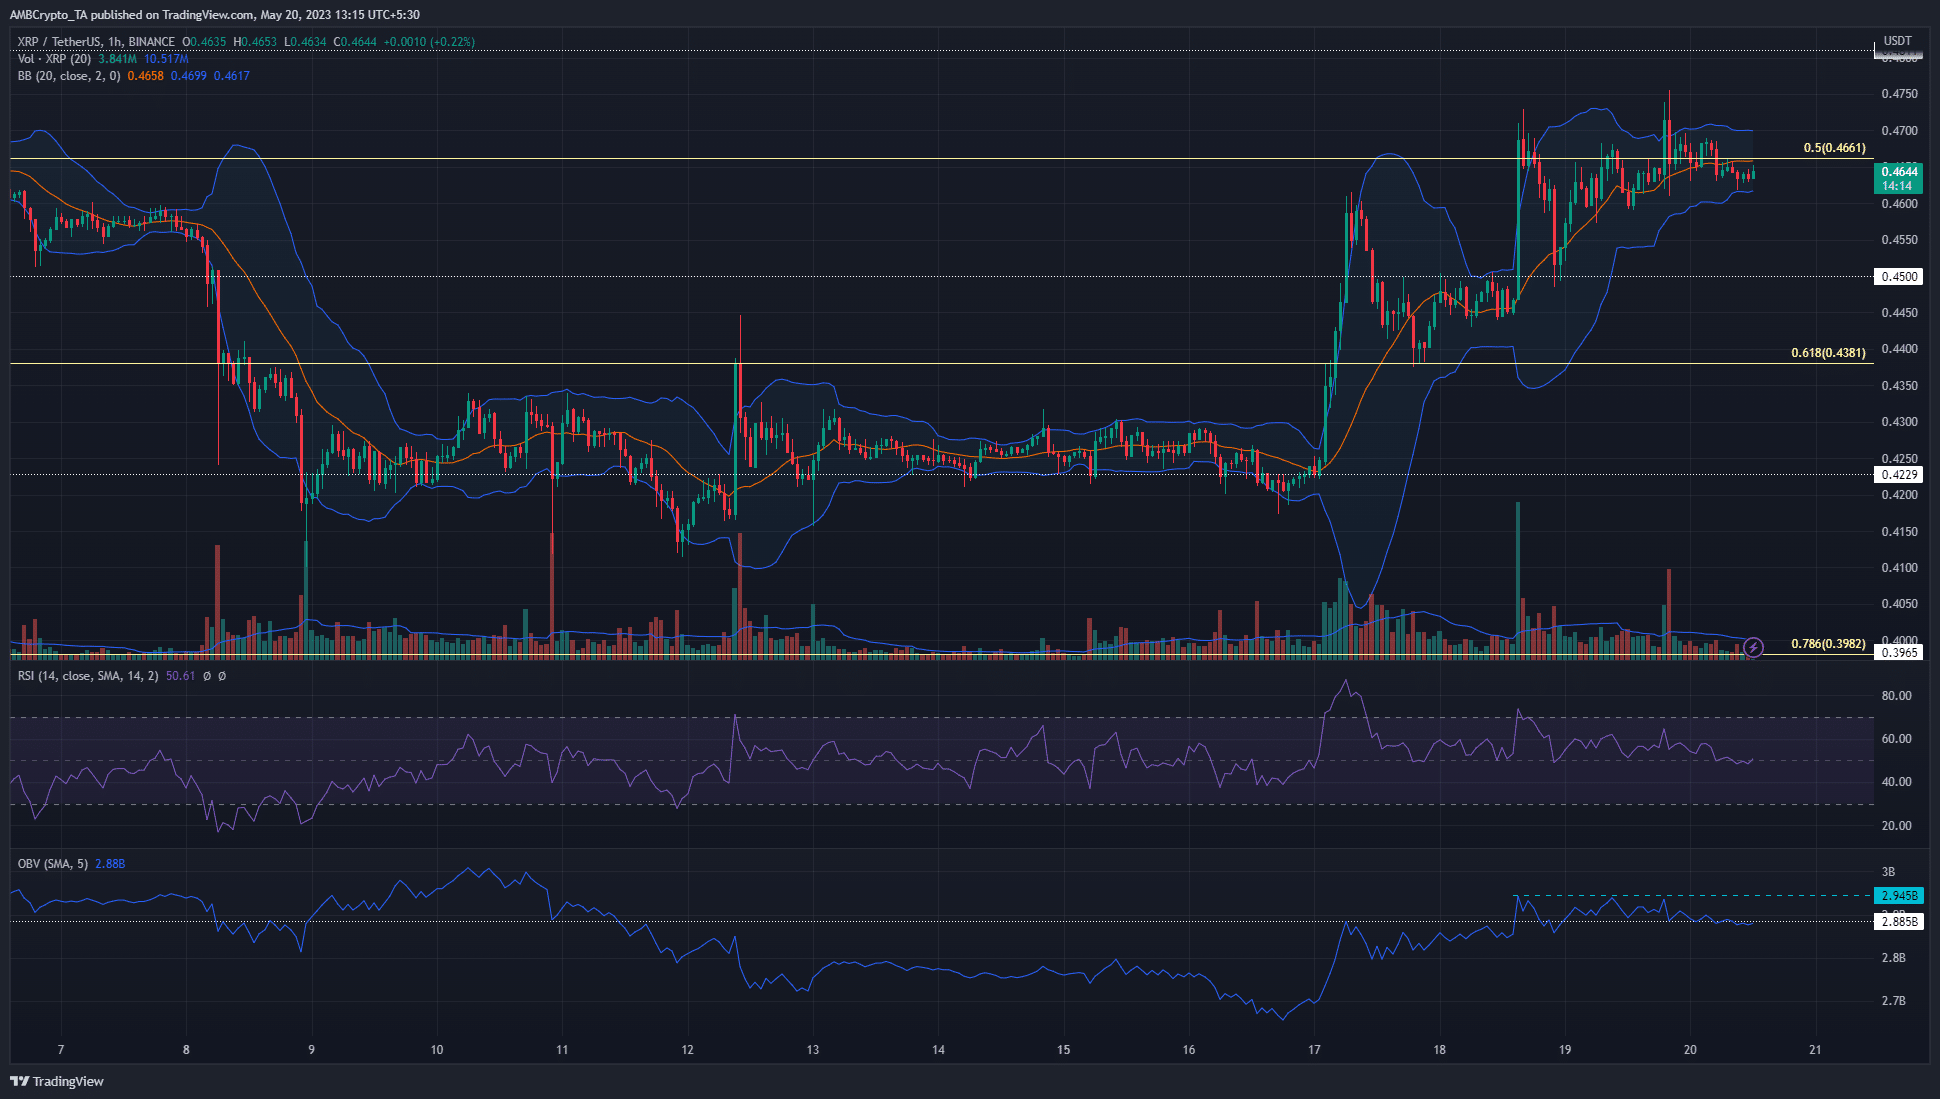
- Lowered volatility on weekend could explain the tightening Bollinger Bands.
Ripple [XRP] has performed well over the past few days. A recent report highlighted that the daily timeframe market structure was bearish despite the bounce from the $0.423 support. The CVD also showed steady demand recently.
Realistic or not, here’s XRP’s market cap in BTC’s terms
Over the past 48 hours, XRP bulls struggled to flip the $0.46 resistance to support. It was also a higher timeframe Fibonacci retracement level. Further north, the $0.481 level is also expected to pose resistance.
Will XRP bulls push past the $0.466 resistance?
The daily timeframe bias was bearish, as the market structure remained bearish. But the one-hour chart exhibited a bullish structure after the 103% move upward on 17 May. Since then, the RSI was also above the neutral 50 mark.
At the time of writing, it showed a heightened chance of slipping below the 50 mark. This likelihood was due to the findings from the OBV. On the recent rally, the OBV faced a local resistance level. However, the bulls could push past it. Yet, over the past 24 hours the OBV began to slowly descend beneath this level.
If it did fall below, it would highlight heightened selling pressure. XRP could be forced to post losses and the RSI would subsequently reflect losses as well. The Bollinger Bands tightened around the price as well, indicating a phase of compression.
This could be followed by an expansion, although the direction wa
Go to Source to See Full Article
Author: Akashnath S
Tip BTC Newswire with Cryptocurrency
Donate Bitcoin to BTC Newswire

Donate Bitcoin Cash to BTC Newswire

Donate Ethereum to BTC Newswire

Donate Litecoin to BTC Newswire

Donate Monero to BTC Newswire

Donate ZCash to BTC Newswire


