XRP price action is consolidating around major support, with demand consistently stepping in at higher timeframes. If buyers defend this critical region, conditions are aligning for a potential move back toward all-time highs.
Summary
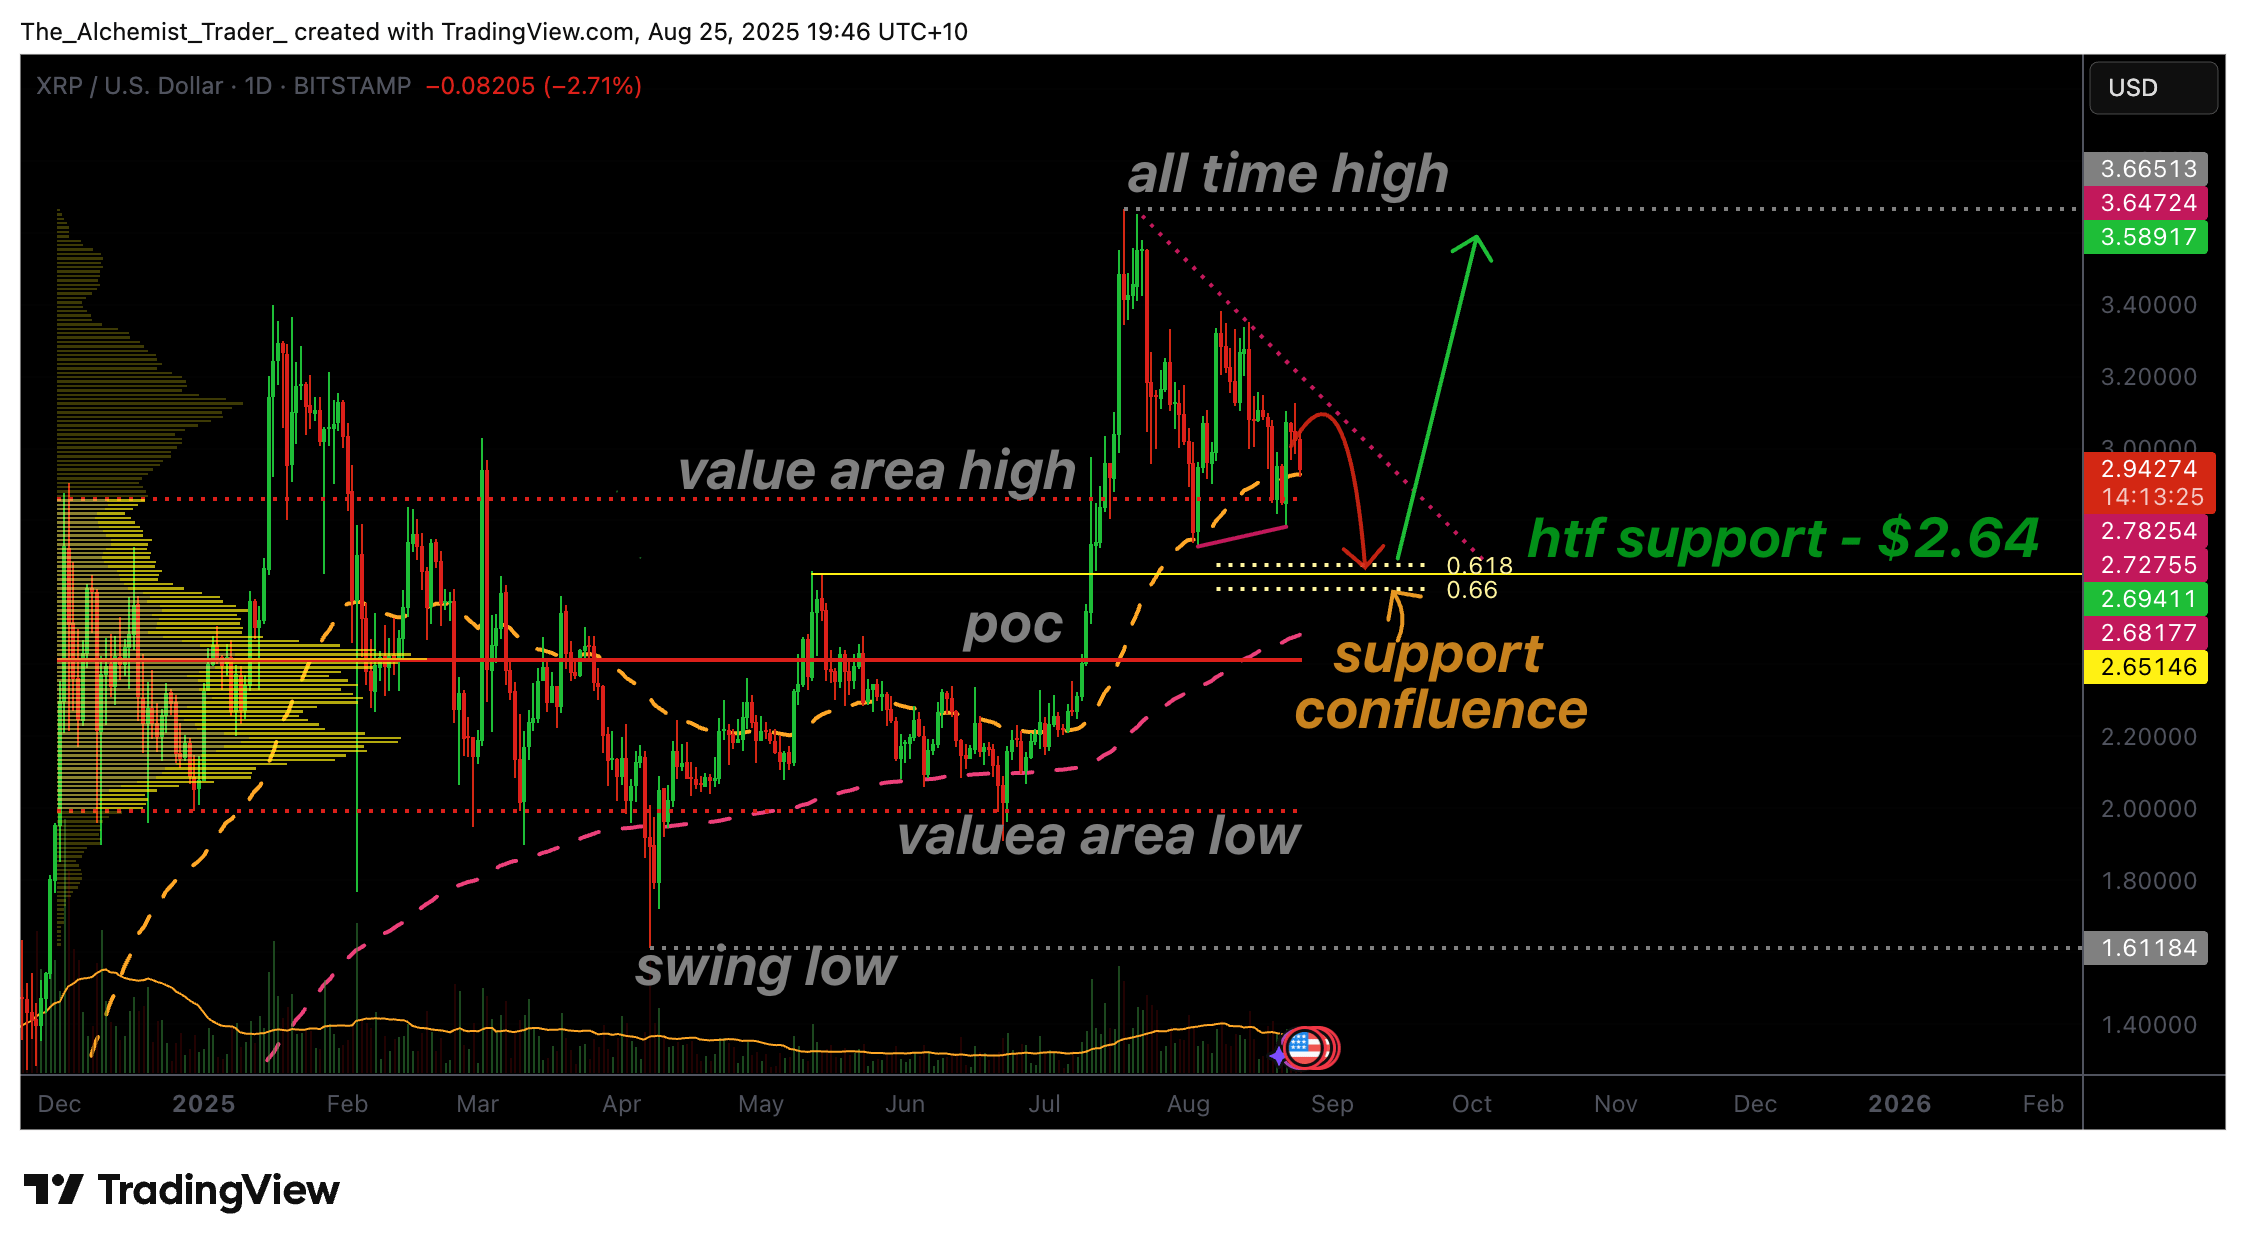
- XRP is consolidating near $2.64 support, with liquidity buildup suggesting a bullish reaction is likely if tested.
- Technical confluence with the 0.618 Fibonacci and moving average reinforces the support zone.
- A breakout above dynamic resistance could fuel a rally toward $3.65 and potentially new highs.
Ripple (XRP) price has entered a corrective phase despite some notable catalysts for growth, but higher timeframe charts remain bullish as demand continues to appear near critical support levels. The $2.64 region has emerged as a pivotal zone where liquidity buildup is visible, suggesting a potential reaction if officially tested. With moving averages and Fibonacci confluence adding weight to the level, traders are closely watching whether a reversal will spark the next leg higher.
Key XRP price technical points
- High Timeframe Support at $2.64: Region shows strong demand and liquidity buildup, yet to be fully tested.
- Confluence with MA and 0.618 Fibonacci: Technical alignment strengthens the probability of a bullish reversal.
- Dynamic Resistance Break Needed: Clearing resistance would open a path toward the all-time high at $3.65.
XRP’s price action has been gradually correcting, but wicks around $2.64 highlight sustained buying pressure at this key support. Despite not being officially tested with a candle body, the demand profile suggests that an eventual retest could trigger a bullish reaction. Liquidity buildup above this zone further raises the probabil
Go to Source to See Full Article
Author: Aziz Zamani