
XRP analysts highlighted the potential for a rebound to $1.95 as the price broke above a symmetrical triangle amid persistent institutional demand.
XRP (XRP) price is up 5.5% over 24 hours and 3% in seven days, trading around $1.40 on Wednesday. This puts XRP in a position for further gains backed by several market and technical factors, according to analysts.
Key takeaways:
XRP ETF demand makes a comeback
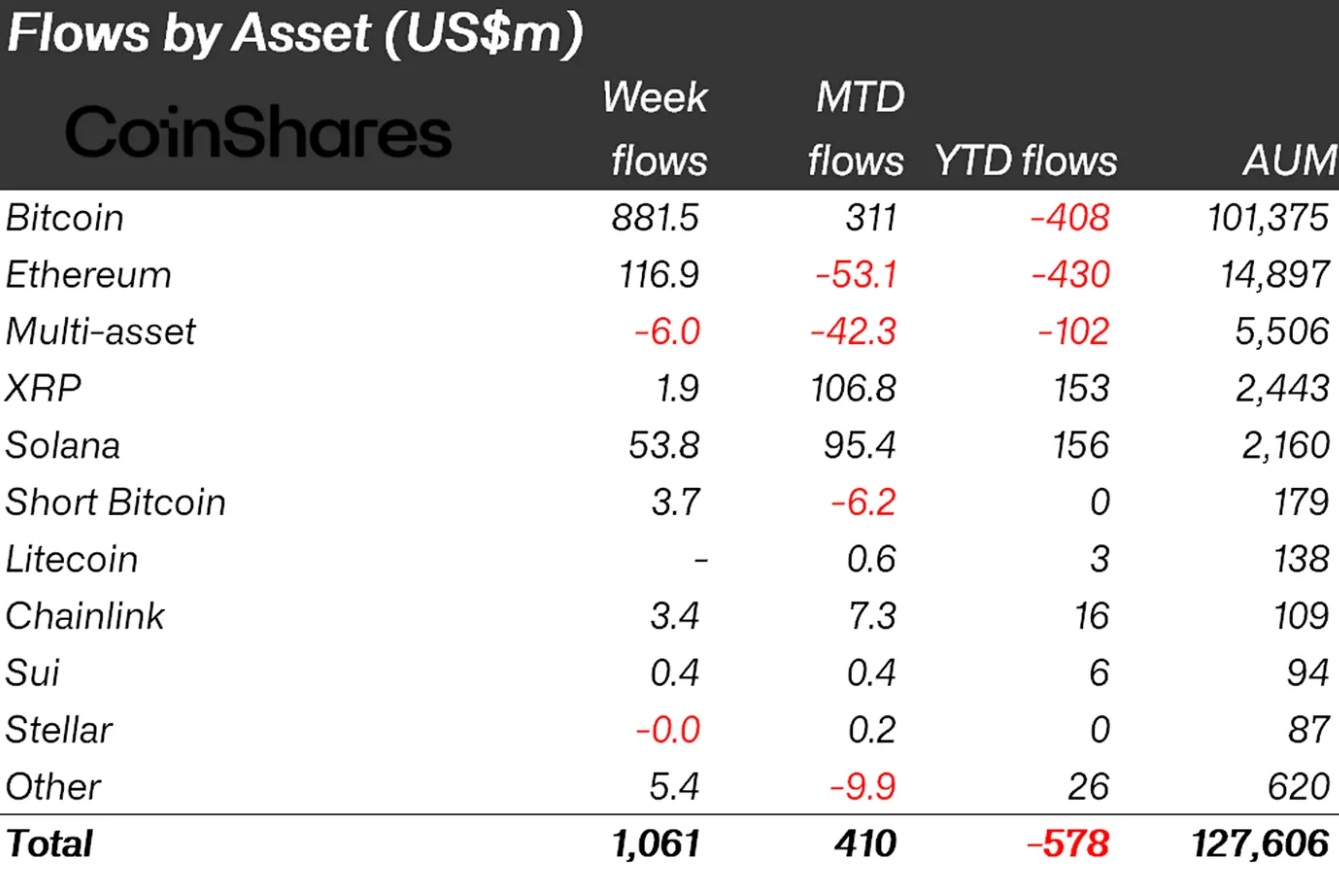
Institutional demand for XRP investment products has been strengthening, according to data from CoinShares.
Related: XRP sentiment plummets, which could set token up for rally: Santiment
XRP exchange-traded products (ETPs) posted inflows totaling $106.8 million in February and $1.9 million during the week ending Feb. 27. These investment products have now recorded $153 million in net inflows so far in 2026, bringing the total assets under management (AUM) to $2.4 billion.
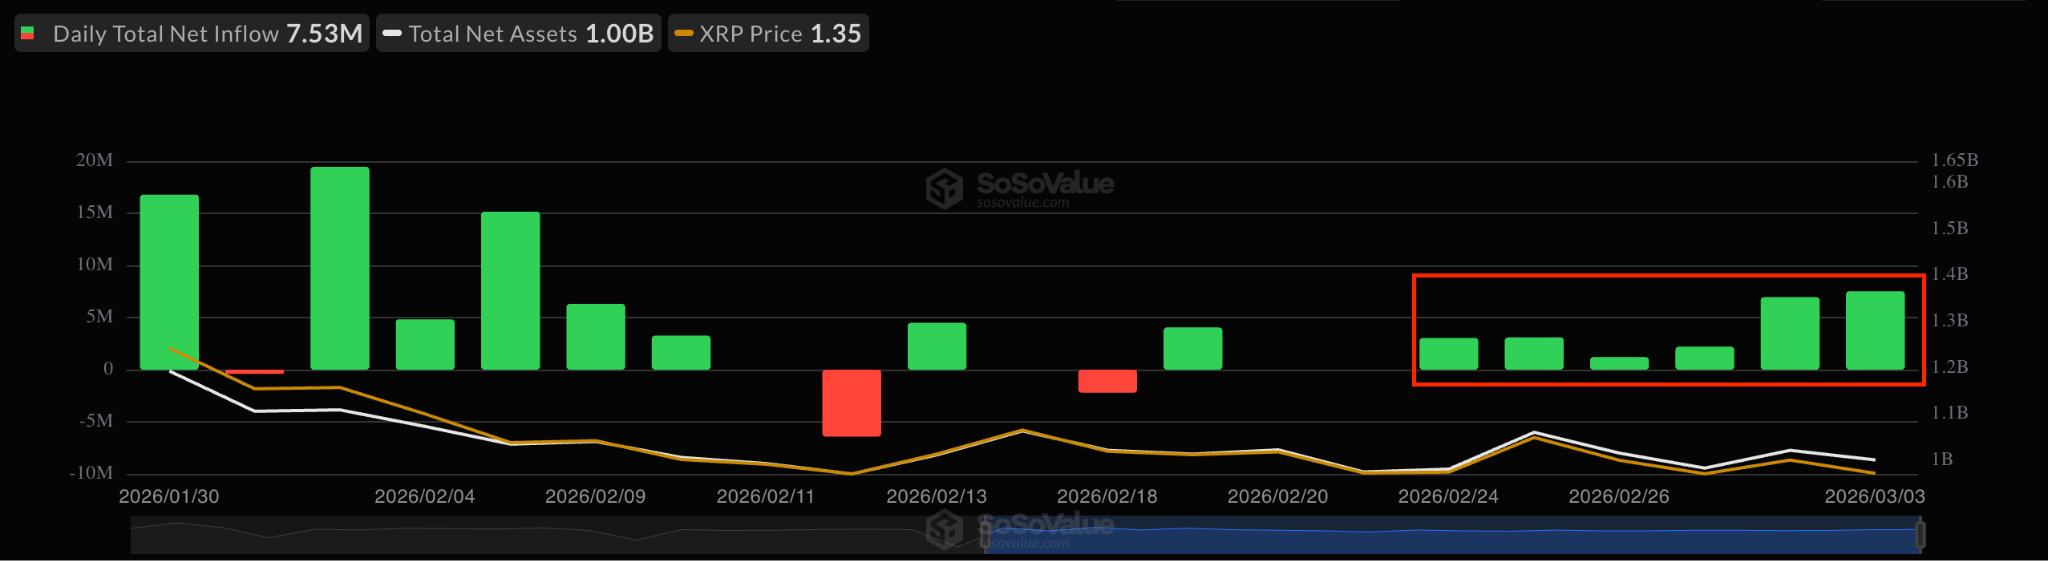
Meanwhile, flows into spot XRP exchange-traded funds (ETFs) continue, with $7.53 million on Tuesday, marking five consecutive days of net inflows. This streak has pushed cumulative inflows to nearly $1.25 billion and AUM to $1 billion, per data from SoSoValue.
This indicates an increased institutional appetite for XRP products, despite the price declining 25% in 2026.
“Spot XRP ETFs recorded $9.55M in net inflows during the Feb. 23–27 trading week,” crypto analyst Xaif Crypto said in a Monday post on X, adding:
“This is a sign that institutional appetite for XRP isn’t slowing down.”
As Cointelegraph reported, whale distribution has been easing amid rising larger-holder balances, improving XRP’s chances of a price recovery.
XRP symmetrical triangle breakout targets $1.95
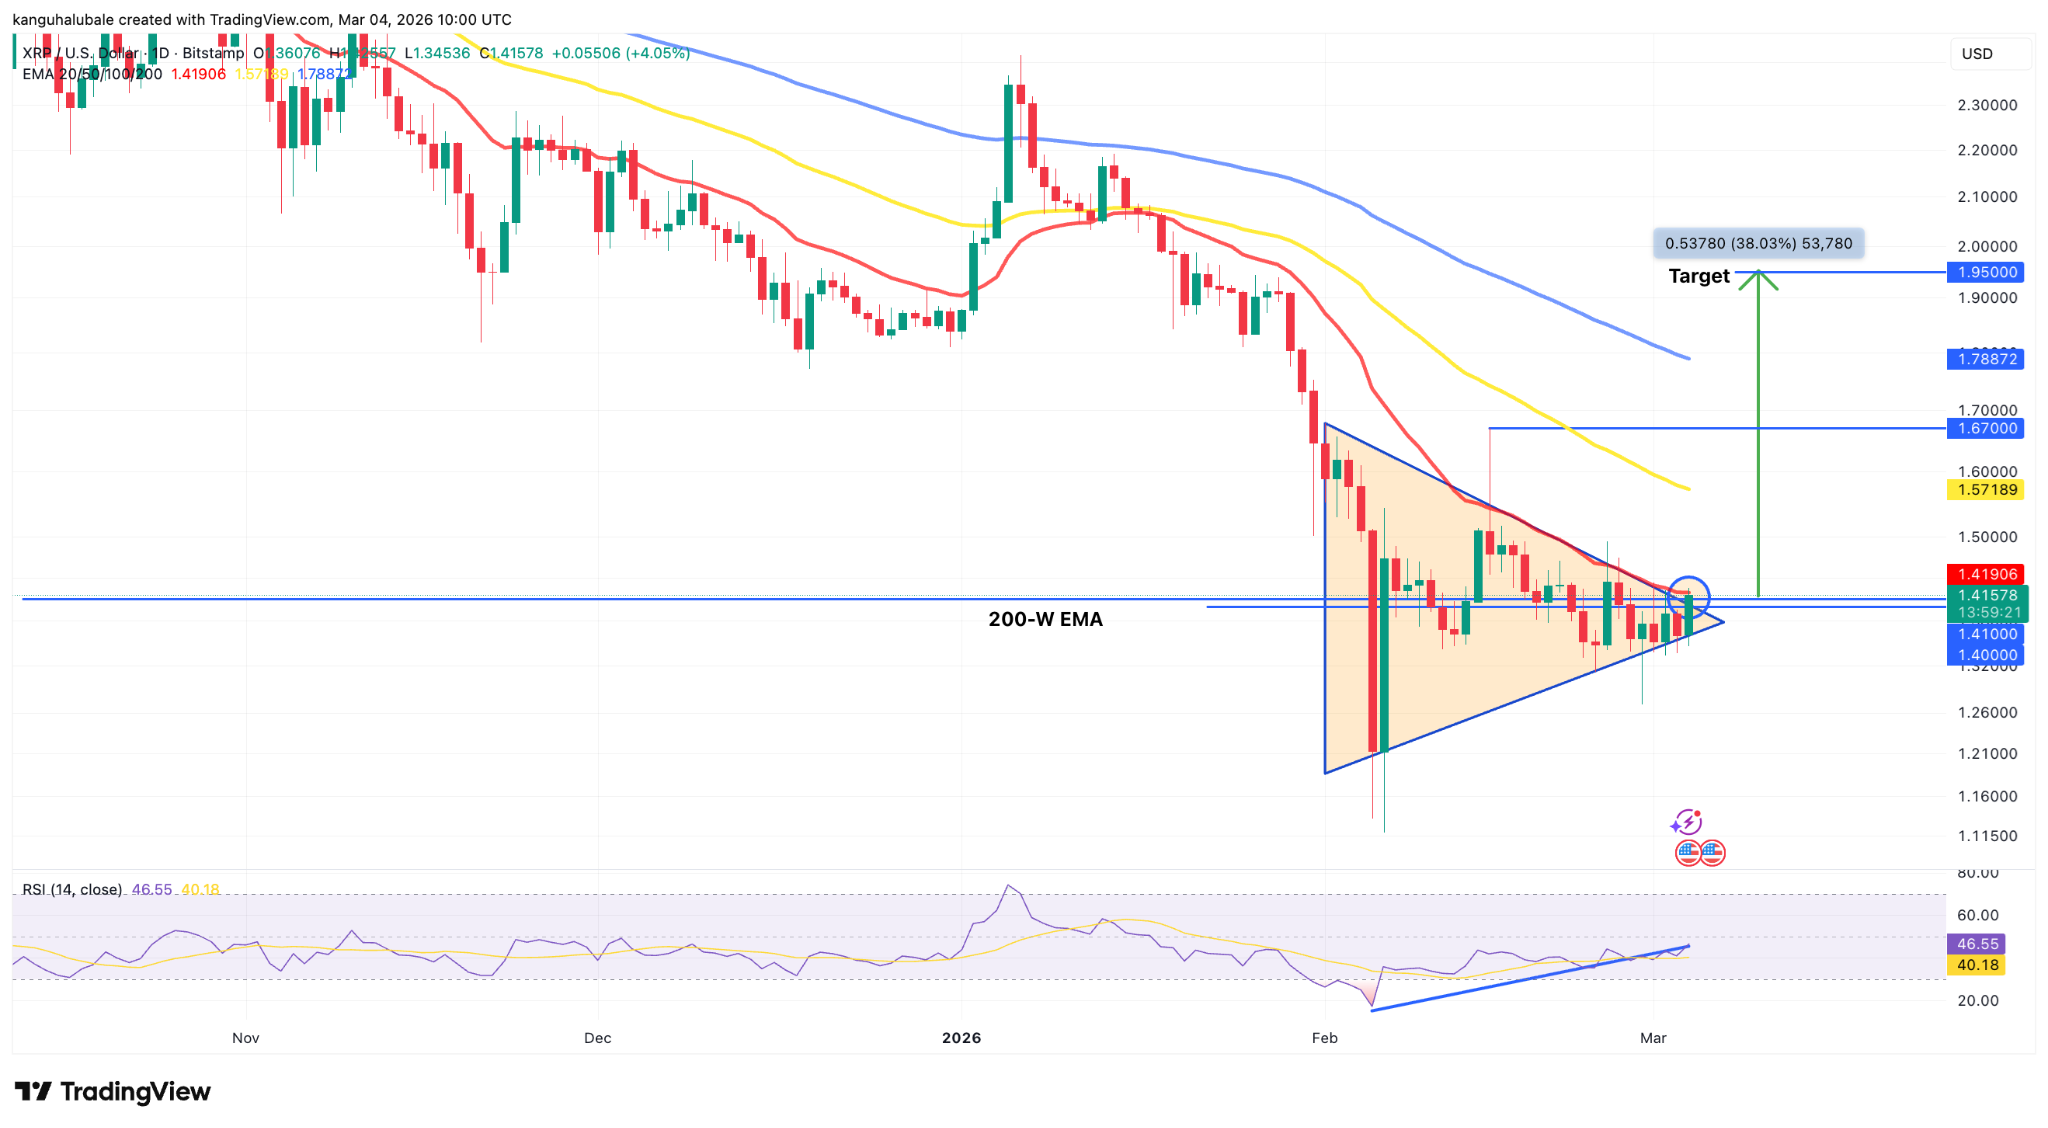
Data from TradingView shows XRP attempting to break out from a symmetrical triangle on the daily time frame, as shown in the chart below.
The XRP/USD pair must close above the upper trendline of the triangle at $1.40, coinciding with the 200-week exponential moving average (EMA), to maintain bullish momentum.
The XRP price is “pushing above the 200-week EMA,” said analyst Egrag Crypto in a Wednesday post on X, adding:
“If we get a weekly close above the 200 EMA and $1.55, then short-term strength increases and momentum shifts.”
The measured target of the pattern, calculated by adding the triangle’s height to the breakout point, is $1.95, or 38% above the current price.
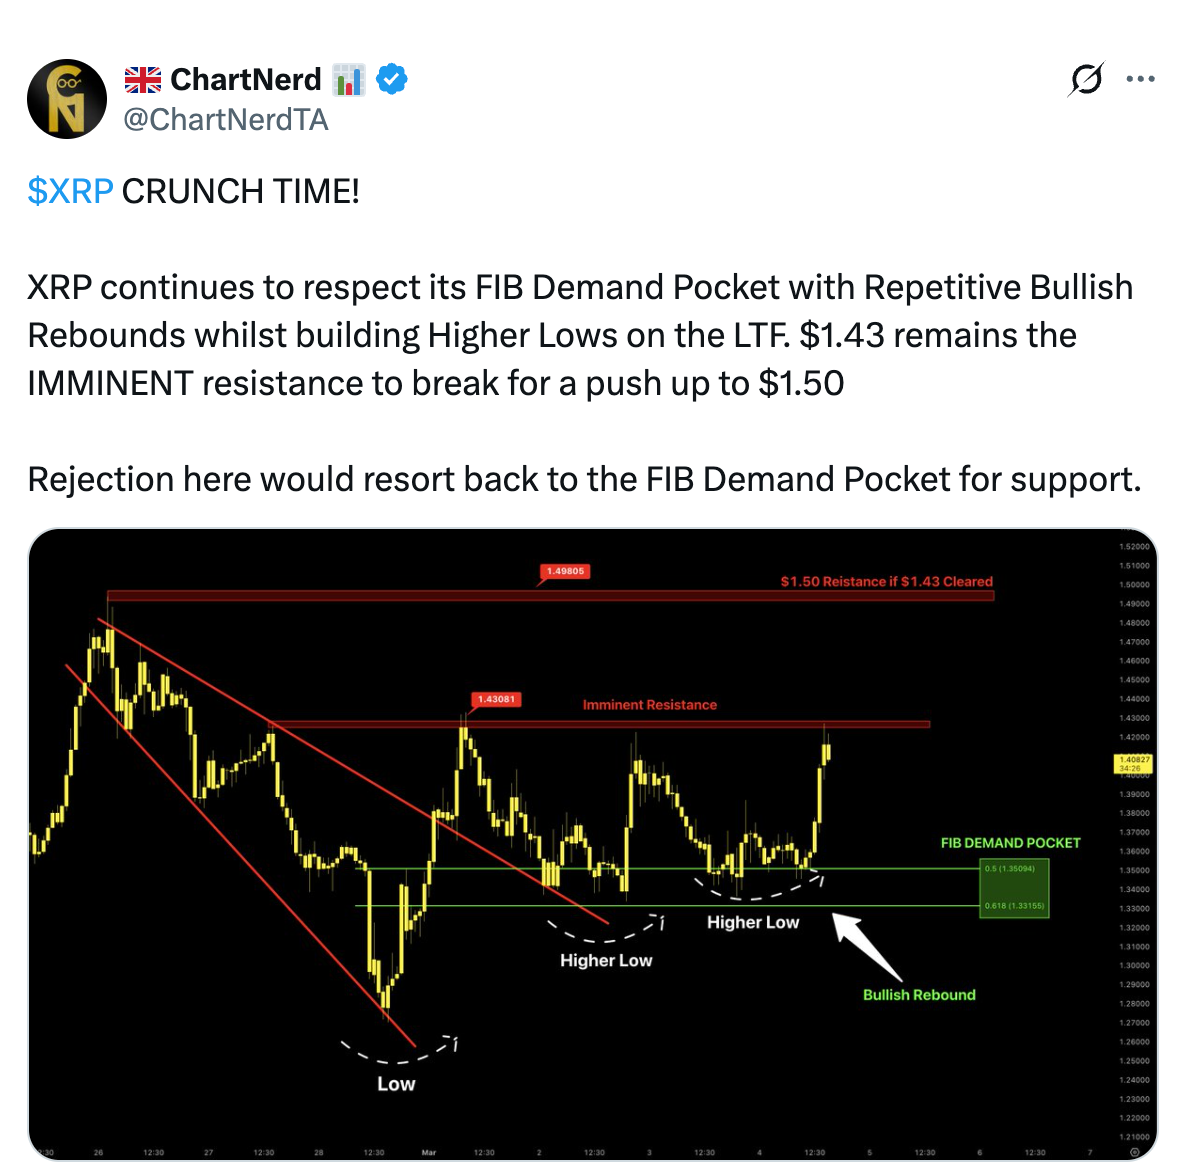
Technical analyst and trader ChartNerd said that $1.43 “remains the imminent resistance to break for a push up to $1.50.”
As Cointelegraph reported, a daily candlestick close above the 20-day EMA at $1.42 would confirm a break of structure and possibly lead to a move toward the 50-day SMA at $1.63.
This article does not contain investment advice or recommendations. Every investment and trading move involves risk, and readers should conduct their own research when making a decision. While we strive to provide accurate and timely information, Cointelegraph does not guarantee the accuracy, completeness, or reliability of any information in this article. This article may contain forward-looking statements that are subject to risks and uncertainties. Cointelegraph will not be liable for any loss or damage arising from your reliance on this information.

Go to Source to See Full Article
Author: Nancy Lubale