- RSI and MACD’s readings on XRP’s price charts highlighted minimal divergence
- XRP continues to hold above the 50-day MA at $2.26, despite losses over last 24 hours
XRP continues to dominate market discussions, fueled by significant price movements and heightened social engagement. At the time of writing, XRP was trading at $2.44, following a 2.62% intraday decline. Despite the dip, however, its technical setup and broader market signals presented a complex narrative for traders and investors alike.
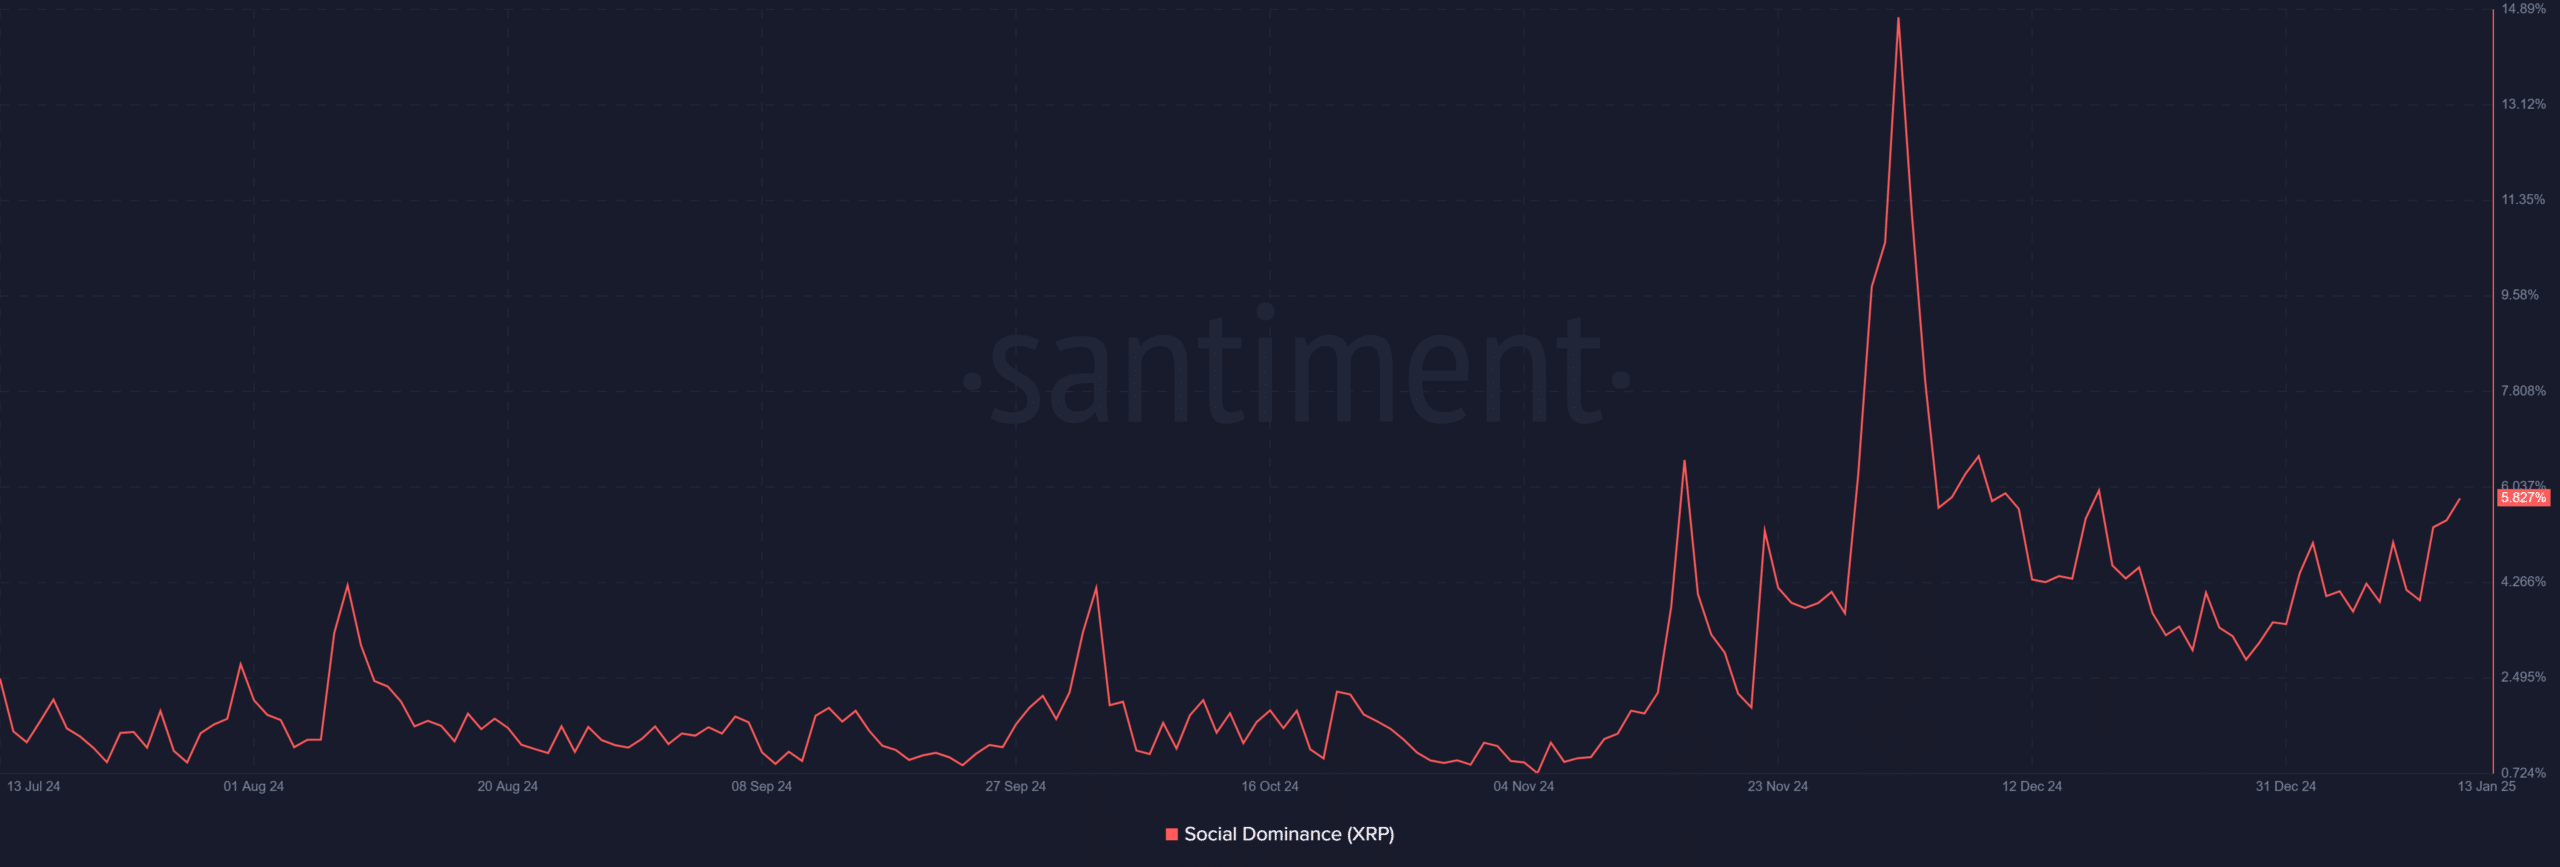
XRP’s social dominance surges
Santiment’s Social Dominance chart revealed a sharp uptick in discussions around XRP, climbing to 5.8% of all crypto mentions. This marks one of the highest levels of engagement for it in recent months, signaling growing interest from retail investors.
Such surges in social dominance often precede significant price movements, though they also introduce volatility.
While a hike in social activity can spark short-term momentum, it may also signal speculative behavior. Historically, similar spikes in XRP’s social dominance have been followed by either sharp rallies or abrupt corrections, making this metric an essential consideration for traders.
XRP’s support and resistance levels
XRP‘s price chart on TradingView highlighted a critical battle between bullish and neutral signals. The 50-day moving average at $2.26 sat above the 200-day moving average, forming a golden cross. This bullis
Go to Source to See Full Article
Author: Adewale Olarinde