
The XRP price has fallen since July 2023, creating a lower high in November.
XRP trades at a confluence of long- and short-term support levels. Will it break down or bounce?
Ripple Price at Risk of Long-Term Breakdown?
The weekly time frame technical analysis shows that XRP has increased alongside an ascending support trend line since November 2022. The trend line has been validated eight times (green icons) so far.
However, depending on the weekly close, the XRP price risks breaking down from the trend line. So far, the trend line has existed for nearly 450 days.
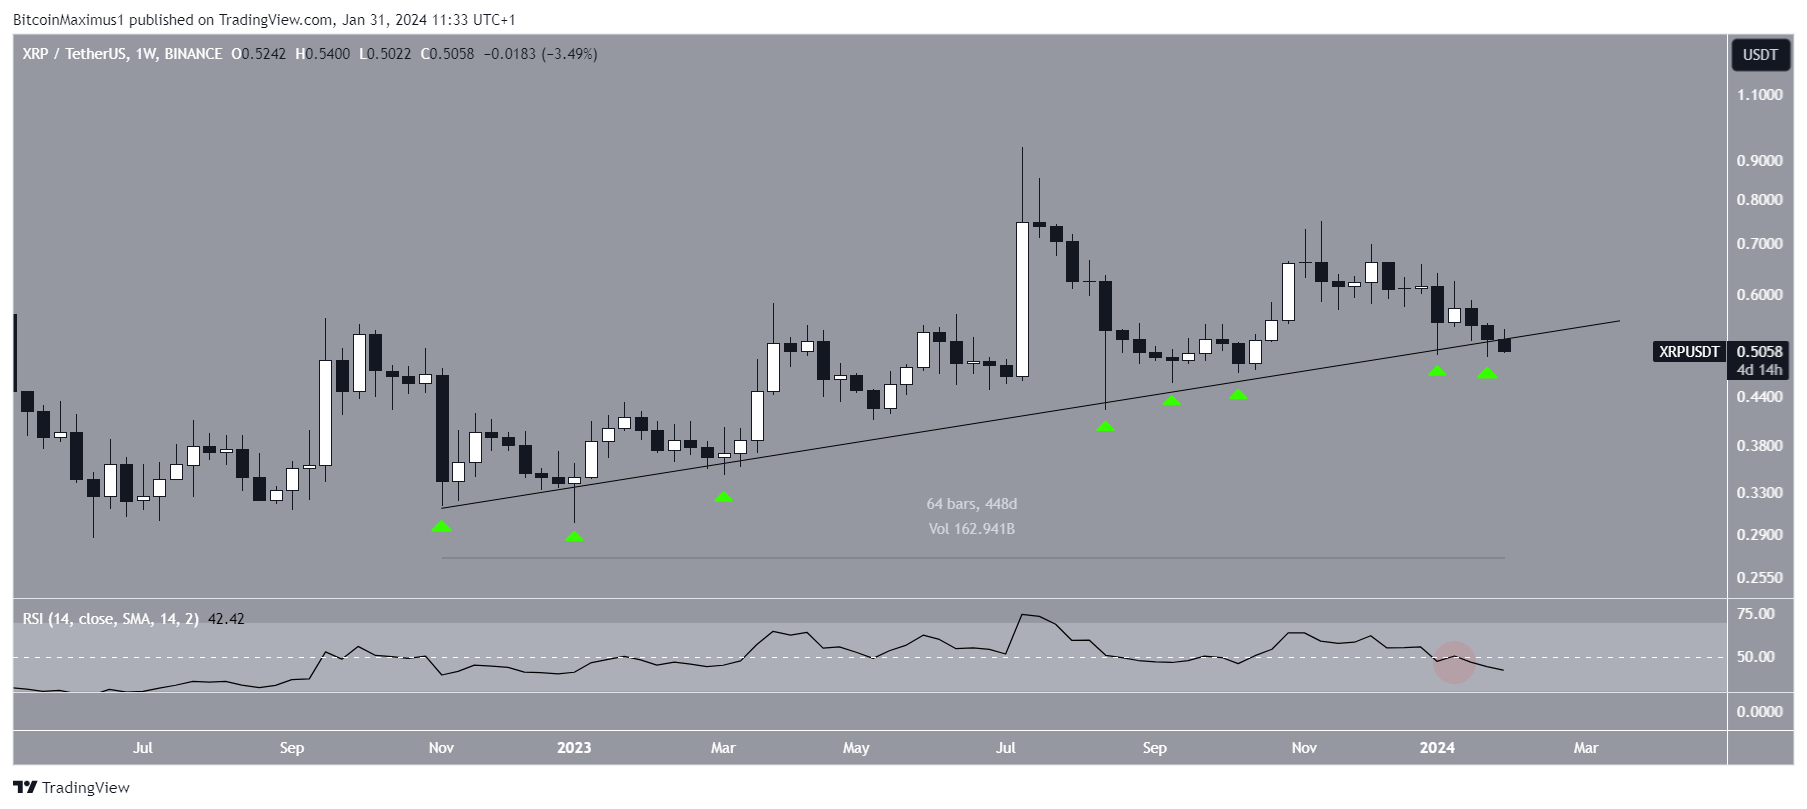
The weekly Relative Strength Index (RSI) supports the breakdown. When evaluating market conditions, traders use the RSI as a momentum indicator to determine whether a market is overbought or oversold and whether to accumulate or sell an asset.
If the RSI reading is above 50 and the trend is upward, bulls still have an advantage, but if the reading is below 50, the opposite is true. The indicator is below 50 and falling (red circle), considered a sign of a bearish t
Go to Source to See Full Article
Author: Valdrin Tahiri
Tip BTC Newswire with Cryptocurrency
Donate Bitcoin to BTC Newswire

Donate Bitcoin Cash to BTC Newswire

Donate Ethereum to BTC Newswire

Donate Litecoin to BTC Newswire

Donate Monero to BTC Newswire

Donate ZCash to BTC Newswire


