
Bitcoin’s rebound on March 4 looked odd if you only watched it through the usual “risk assets are breaking” lens. Oil was jumping, shipping insurers were repricing war risk, and traders were treating the Strait of Hormuz like a live wire. All of the headlines had the cadence of a full-blown crisis.
However, Bitcoin climbed back into the same $70,000 zone it has been orbiting for weeks, despite seeing a notable drop the weekend before.
Two factors explain that move.
The first is a pretty straightforward macro influence. Whenever the Middle East starts seeing oil shocks, markets quickly price in higher energy costs, messier supply chains, and a whole other range of negative outcomes. Joint US and Israeli strikes on Iran and retaliatory attacks across the Gulf caused disruptions in the Strait of Hormuz and led to a severe energy shock.
As threats around the Strait intensified, war risk insurance and freight rates spiked, leading to a quick surge in oil and gas prices.
The second factor is derivatives. While it’s not the only cause of the recovery, it explains why BTC can drop on shock and then rebound into a familiar price band even while the market remains nervous. The biggest effect comes from options, where hedging flows can pull the price toward crowded strike zones.
The macro shock supplied the match, but the options market supplied the dry timber already stacked around $70,000.
The shock that hit everything first: oil, Hormuz, and the cost of moving fuel
The Strait of Hormuz is a critical transit chokepoint in the global oil and gas trade. Data from 2024 showed around 20 million barrels passed through the Strait each day, equal to about 20% of the entire global consumption of petroleum liquids. (eia.gov)
When conditions in that narrow channel deteriorate, the market quickly reprices logistics, insurance, and the practical ability to export.
Between Feb. 28 and March 4, the Iran war threw the oil market into one of its biggest shocks in decades. The strikes and retaliation that followed threatened exports from the world’s most important oil-producing region.
As traffic through the strait collapsed, shipping costs soared, and insurers were pulling cover and widening risk zones, with some shipping companies even diverting around the Cape of Good Hope.
Oil is the lifeblood of the global economy, and oil prices bleed into everything else. It affects everything from transport costs and airline economics to heating costs, food logistics, and inflation expectations.
So, when oil prices spike because the world’s most important transit route is threatened, investors ask the same questions across markets: where does the risk go now?
Why Bitcoin sold first, then bounced while nerves stayed high
Bitcoin’s first move in a macro shock often looks like a simple set of liquidations. Blaming it on liquidations isn’t surprising, given that Bitcoin trades 24/7, in size, and with fewer friction points than many other instruments. So when traders want to cut exposure quickly, they sell what they can sell quickly.
And part of that is certainly true. Bitcoin dropped after the weekend strikes and saw just under $1 billion liquidated between Feb. 28 and March 1.
That’s the macro narrative: when shock hits, BTC sells quickly and in size.
But the missing piece of the puzzle is why it rebounded faster than everything else and kept pulling toward the same zone that has mattered for weeks. That is where the options market steps in.
The $70,000 area is a crowded intersection in options
Options come with a lot of Greek letters and dense terminology, so they tend to fall down the ladder of importance in times of macroeconomic shocks. But crypto options, and Bitcoin options in particular, have become so large that they have their own gravitational pull.
Large institutions now carry options exposure so large that even the slightest daily price movements force them to hedge.
Gamma measures how quickly an option’s sensitivity changes as the price moves. When gamma is high, small moves in Bitcoin can force larger hedge adjustments. That kind of trading can add speed and amplify short-term swings.
The peak gamma area for options expiring on March 5 and March 6 was around $71,000, with an elevated band from about $70,500 to $73,000. That’s the zone where hedging sensitivity peaks.
Inside it, the market can feel spring-loaded, and dips and rallies tend to travel faster because the hedging response scales up.
The strike data backs up the same point. CoinGlass data shows dense exposure between $70,000 and $75,000, so these two strikes are doing most of the work.
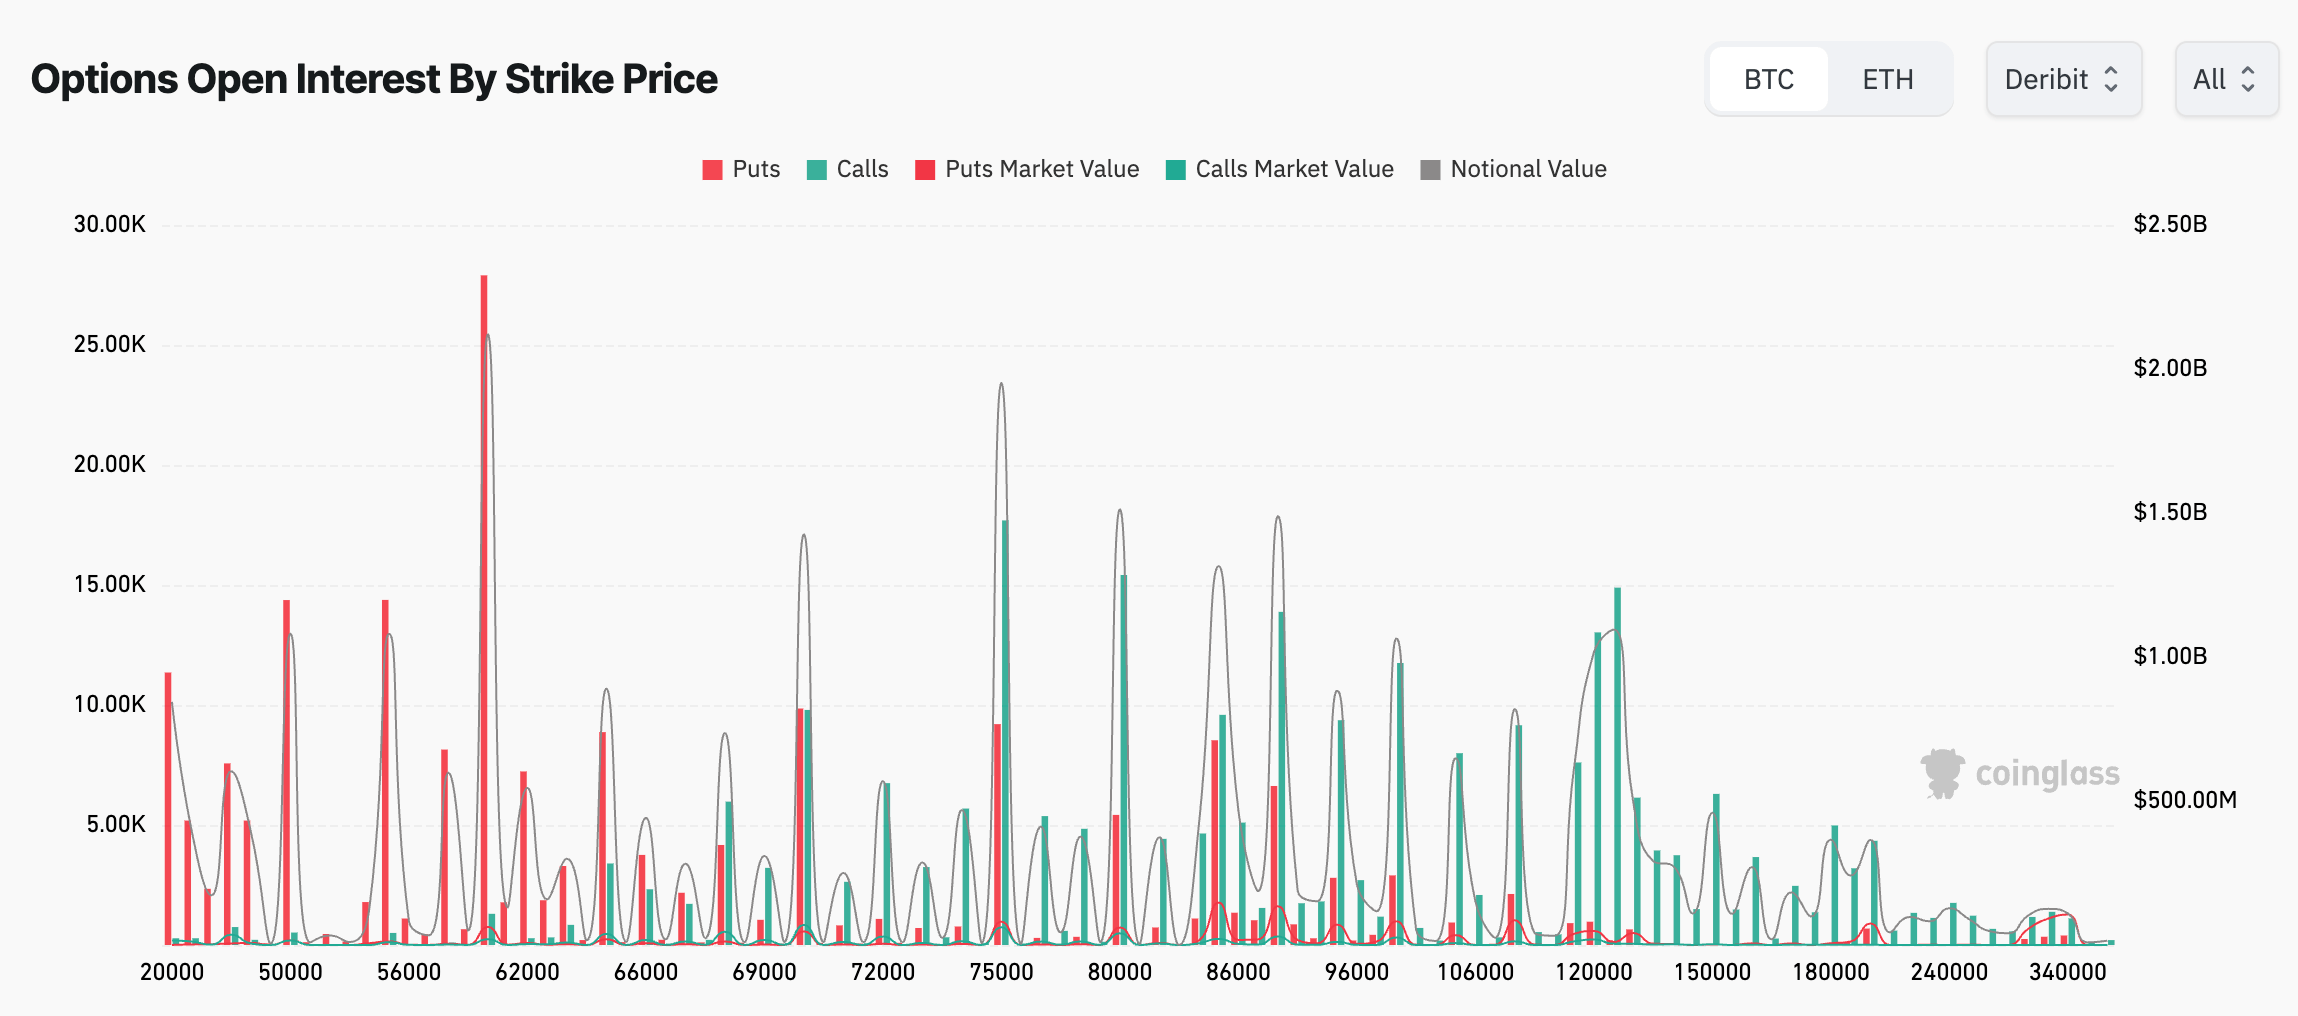
At $70,000, open interest sits around 9.3k puts and 9.25k calls, roughly $1.32 billion in notional exposure. At $75,000, open interest sits around 17.36k calls and 9.41k puts, roughly $1.9 billion in notional. Those figures create a corridor where a lot of risk is anchored to a narrow set of prices.
You can think of it like traffic. A city has roads everywhere, but the congestion happens at chokepoints because many routes intersect there. The chokepoint exists because the map funnels activity through it, and strike clusters do the same thing: they funnel hedging flow through a small band of prices.
March 27 matters because deadlines concentrate behavior
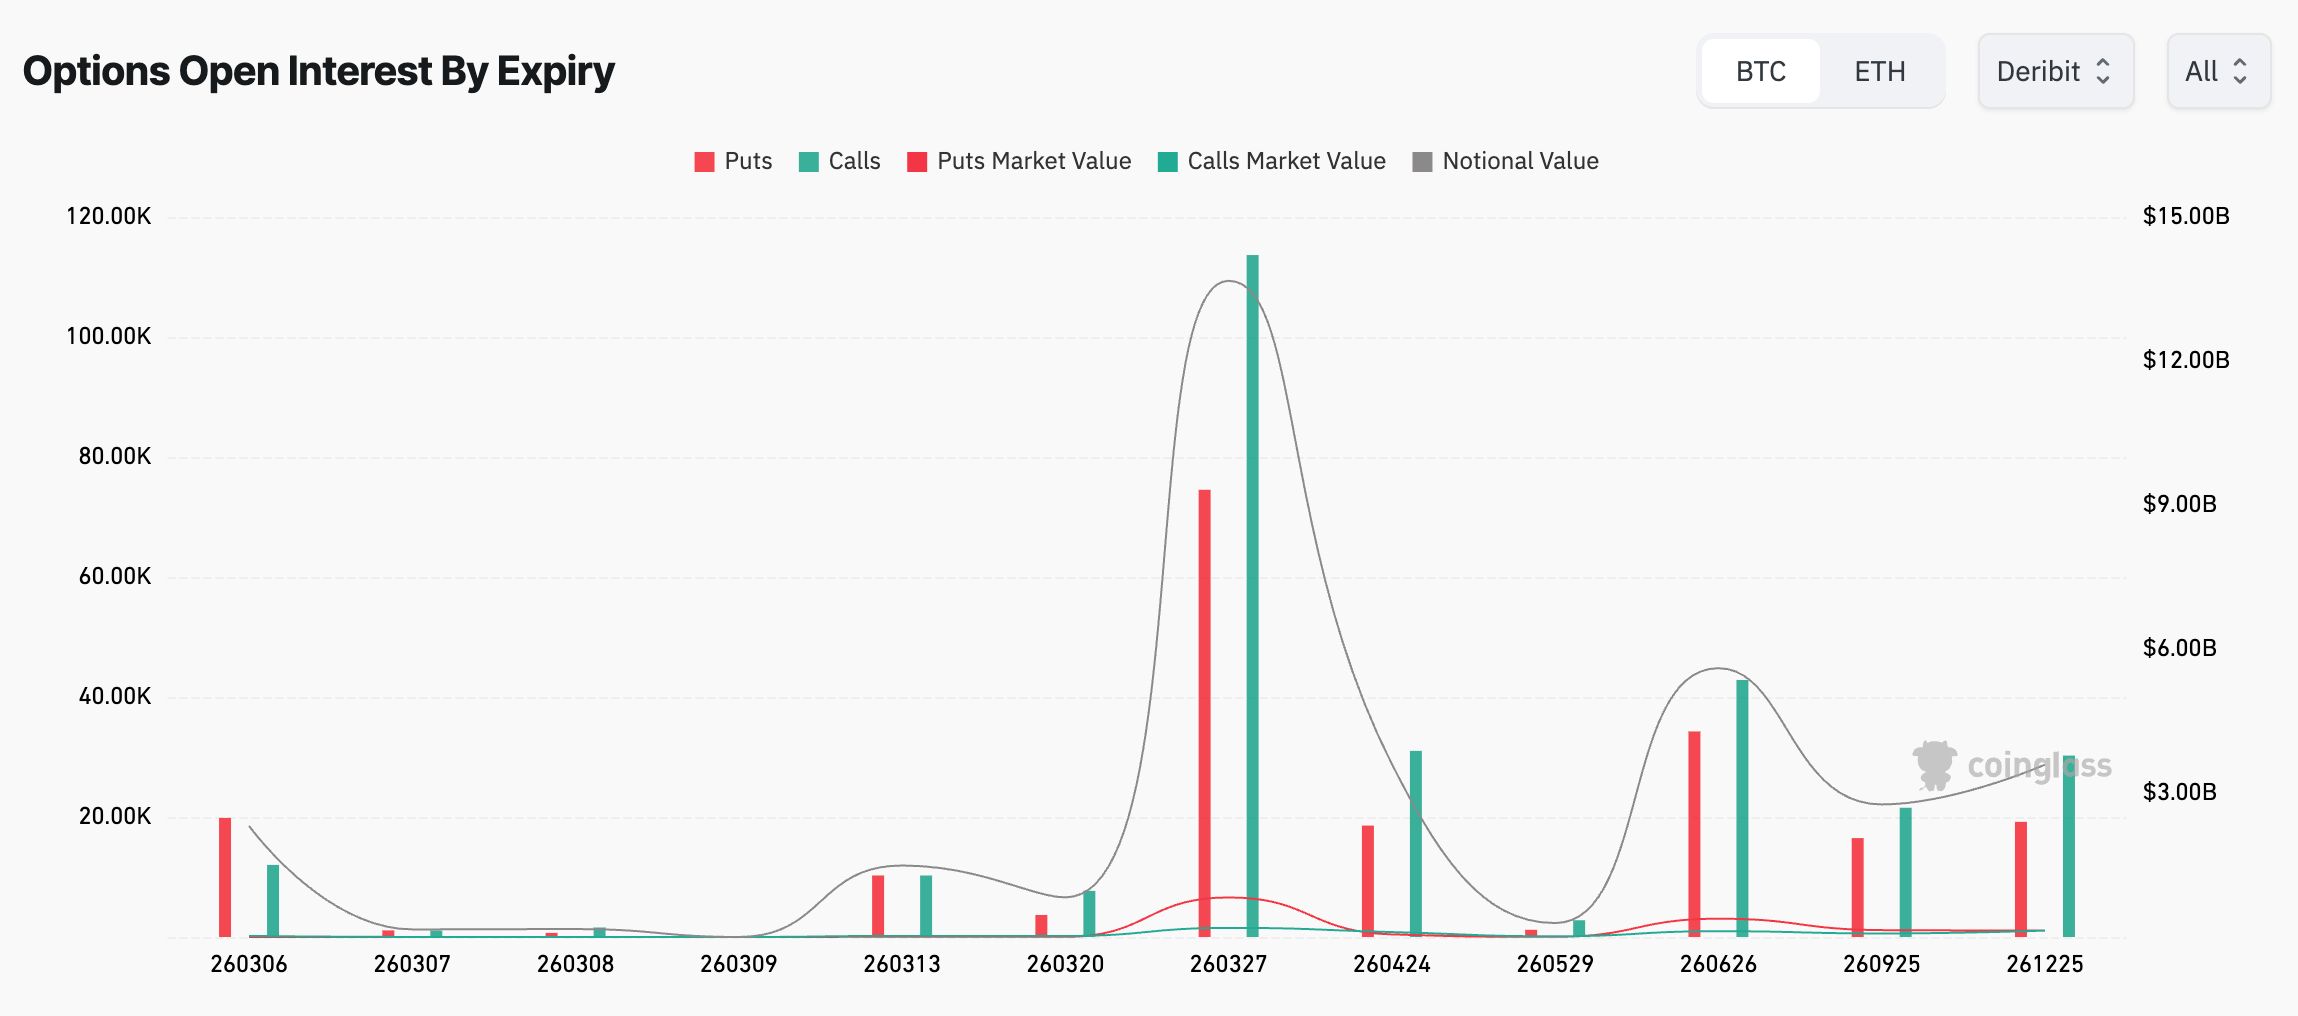
Looking at expiries shows one date dwarfing the rest: March 27.
That expiry carries about 111.7k calls and 74.97k puts, around $13.27 billion in notional exposure.
Total BTC options open interest also rose from about $32 billion in late February to about $36 to $37 billion in early March, which raises the influence of options-related flows during a volatile period.
Large expiries concentrate behavior because time compresses and traders roll positions forward, forcing dealers manage risk more tightly. Hedging can intensify as the calendar moves closer to a large expiry.
That’s why the magnetic effect of certain price points has often strengthened into expiry windows.
The closer the calendar gets to March 27, the more the strike corridor around $70,000 and $75,000 can act like a rail. Price still moves and headlines still matter, and the market also keeps bumping into the same concentrations of risk.
How oil ties to options
The oil shock supplied the volatility, and the options market shaped where the price traveled as the rebound took hold.
A clean sequence fits the window from Feb. 28 through March 4.
First, oil and shipping markets repriced risk quickly as Hormuz conditions worsened and export logistics tightened.
Second, Bitcoin sold in the first wave because it’s liquid and always open, and because investors reduce exposure broadly when volatility rises. (fortune.com)
Third, as the selling faded and price began recovering, Bitcoin ran into a corridor where options exposure is dense between $70,000 and $75,000, with peak gamma around $71,000, where hedging sensitivity is highest. A rebound that reaches into that band can become more reactive because hedgers are forced to adjust more often.
Fourth, funding adds torque. CoinGlass data showed repeated negative funding spikes from late February into early March, each followed by rallies. That fits a market leaning short, because when price goes up, short covering adds buying pressure. That buying can push price into the strike corridor faster, and the high gamma band can amplify the move once price gets there.
Why the $70,000 corridor can keep showing up into late March
A $13.27 billion expiry acts like an anchor. Big expiries pull trading activity toward strikes with heavy open interest, because that’s where rolling and hedging are most concentrated. Strike data points to $70,000 and $75,000 as major nodes in that corridor.
At the same time, the macro backdrop stayed tense. Ongoing volatility keeps Bitcoin acting like a liquid release valve. It sells early in the shock and then rebounds into the places where derivatives positioning concentrates flows.
That’s why $70,000 can keep showing up as a destination even when the headlines have nothing to do with crypto. The market keeps returning to the same area because that’s where the risk sits today.
Three things to watch next
You don’t need to read an options chain to track whether the $70,000 corridor story still fits.
Watch where the biggest strike concentrations sit. If open interest goes higher, the corridor moves with it, and if it shifts lower, the corridor will follow.
Watch the calendar. March 27 is the biggest expiry we’ve seen in a while, and large expiries often reshape positioning when they pass because traders roll or close risk.
Watch the macro volatility tied to oil and shipping. The Hormuz situation pushed crude and shipping costs higher. (reuters.com) If that persists, Bitcoin is likely to keep trading as a fast, liquid asset that sells early and then rebounds into the derivatives zones that concentrate hedging.
An oil shock rattled markets, and Bitcoin dropped first and dropped fast because it’s liquid. The rebound then flowed into a $70,000 to $75,000 corridor where options positioning, hedging sensitivity, and a large late-March expiry make price action more reactive around the same set of levels.
Go to Source to See Full Article
Author: Andjela Radmilac