
The Shiba Inu (SHIB) price finally broke out from a 560-day descending resistance trend line and is attempting to close above it.
Despite the long-term breakout, SHIB faces resistance on the lower timeframes.
SHIB Finally Breaks Out From Long-Term Resistance
The weekly time frame technical analysis shows that the SHIB price broke out from a descending resistance trend line. This trend line had existed for 560 days, successfully rejecting Shiba Inu’s price thrice.
On February 20, SHIB was able to breach such a massive resistance zone and reach a high of $0.00000147 before falling slightly. This was the highest price since February 2023, and SHIB has yet to reach a weekly close above it.
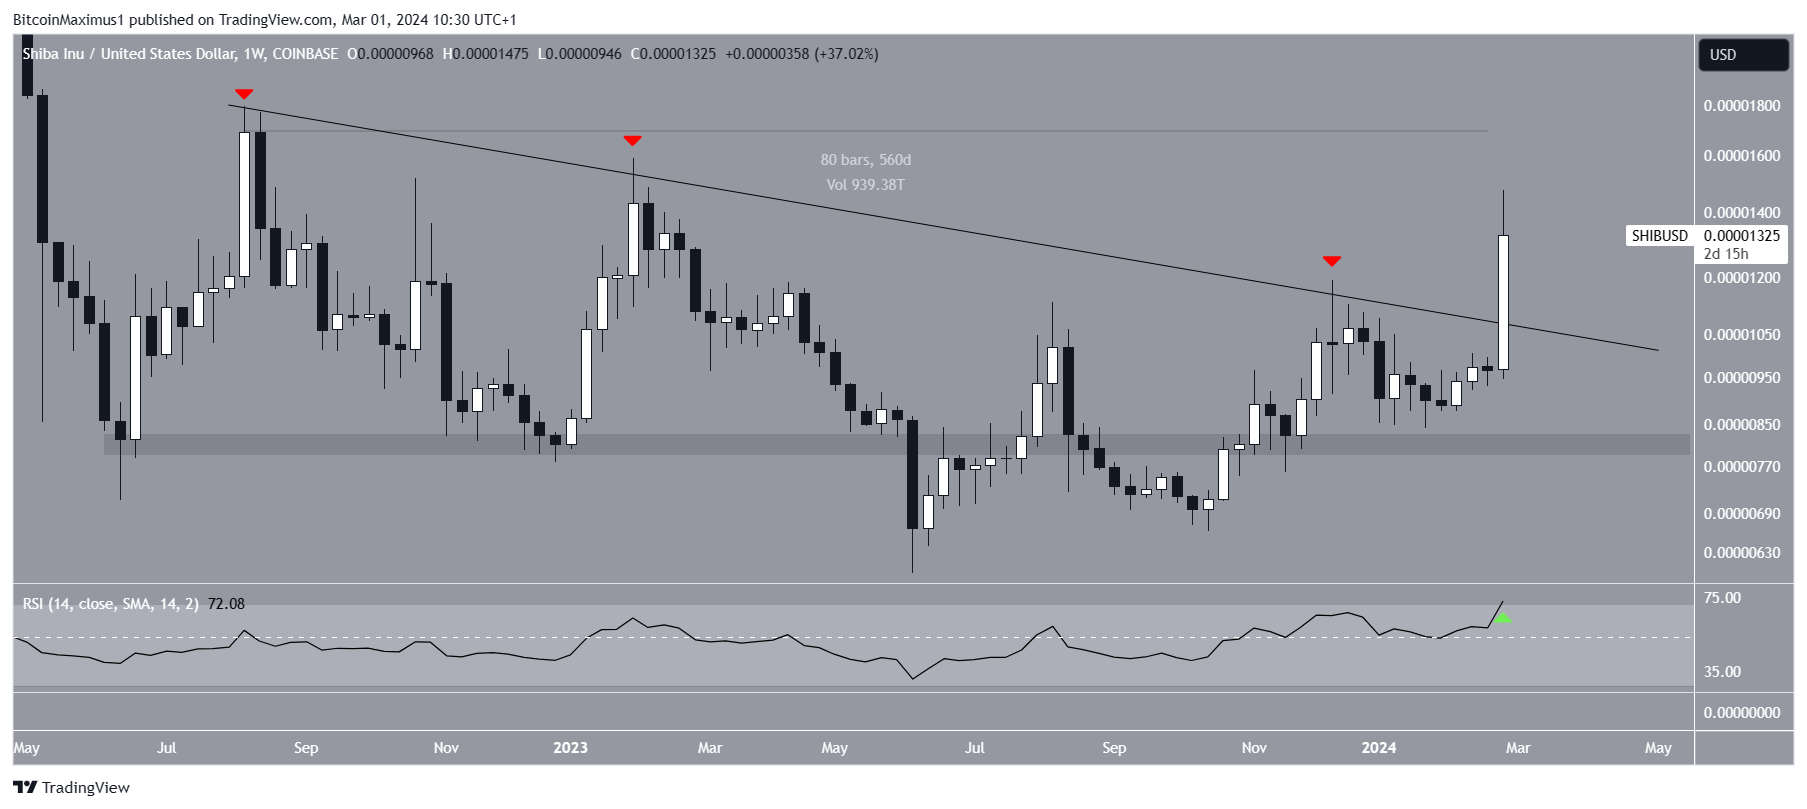
The weekly Relative Strength Index (RSI) supports the breakout. When evaluating market conditions, traders use the RSI as a momentum indicator to determine whether a market is overbought or oversold and whether to accumulate or sell an asset.
Go to Source to See Full Article
Author: Valdrin Tahiri
Tip BTC Newswire with CryptocurrencyDonate Bitcoin to BTC Newswire

Donate Bitcoin Cash to BTC Newswire

Donate Ethereum to BTC Newswire

Donate Litecoin to BTC Newswire

Donate Monero to BTC Newswire

Donate ZCash to BTC Newswire


