Disclaimer: The information presented does not constitute financial, investment, trading, or other types of advice and is solely the writer’s opinion.
- ADA has been on a steady depreciation since July.
- Open Interest rates didn’t improve much despite the recent recovery.
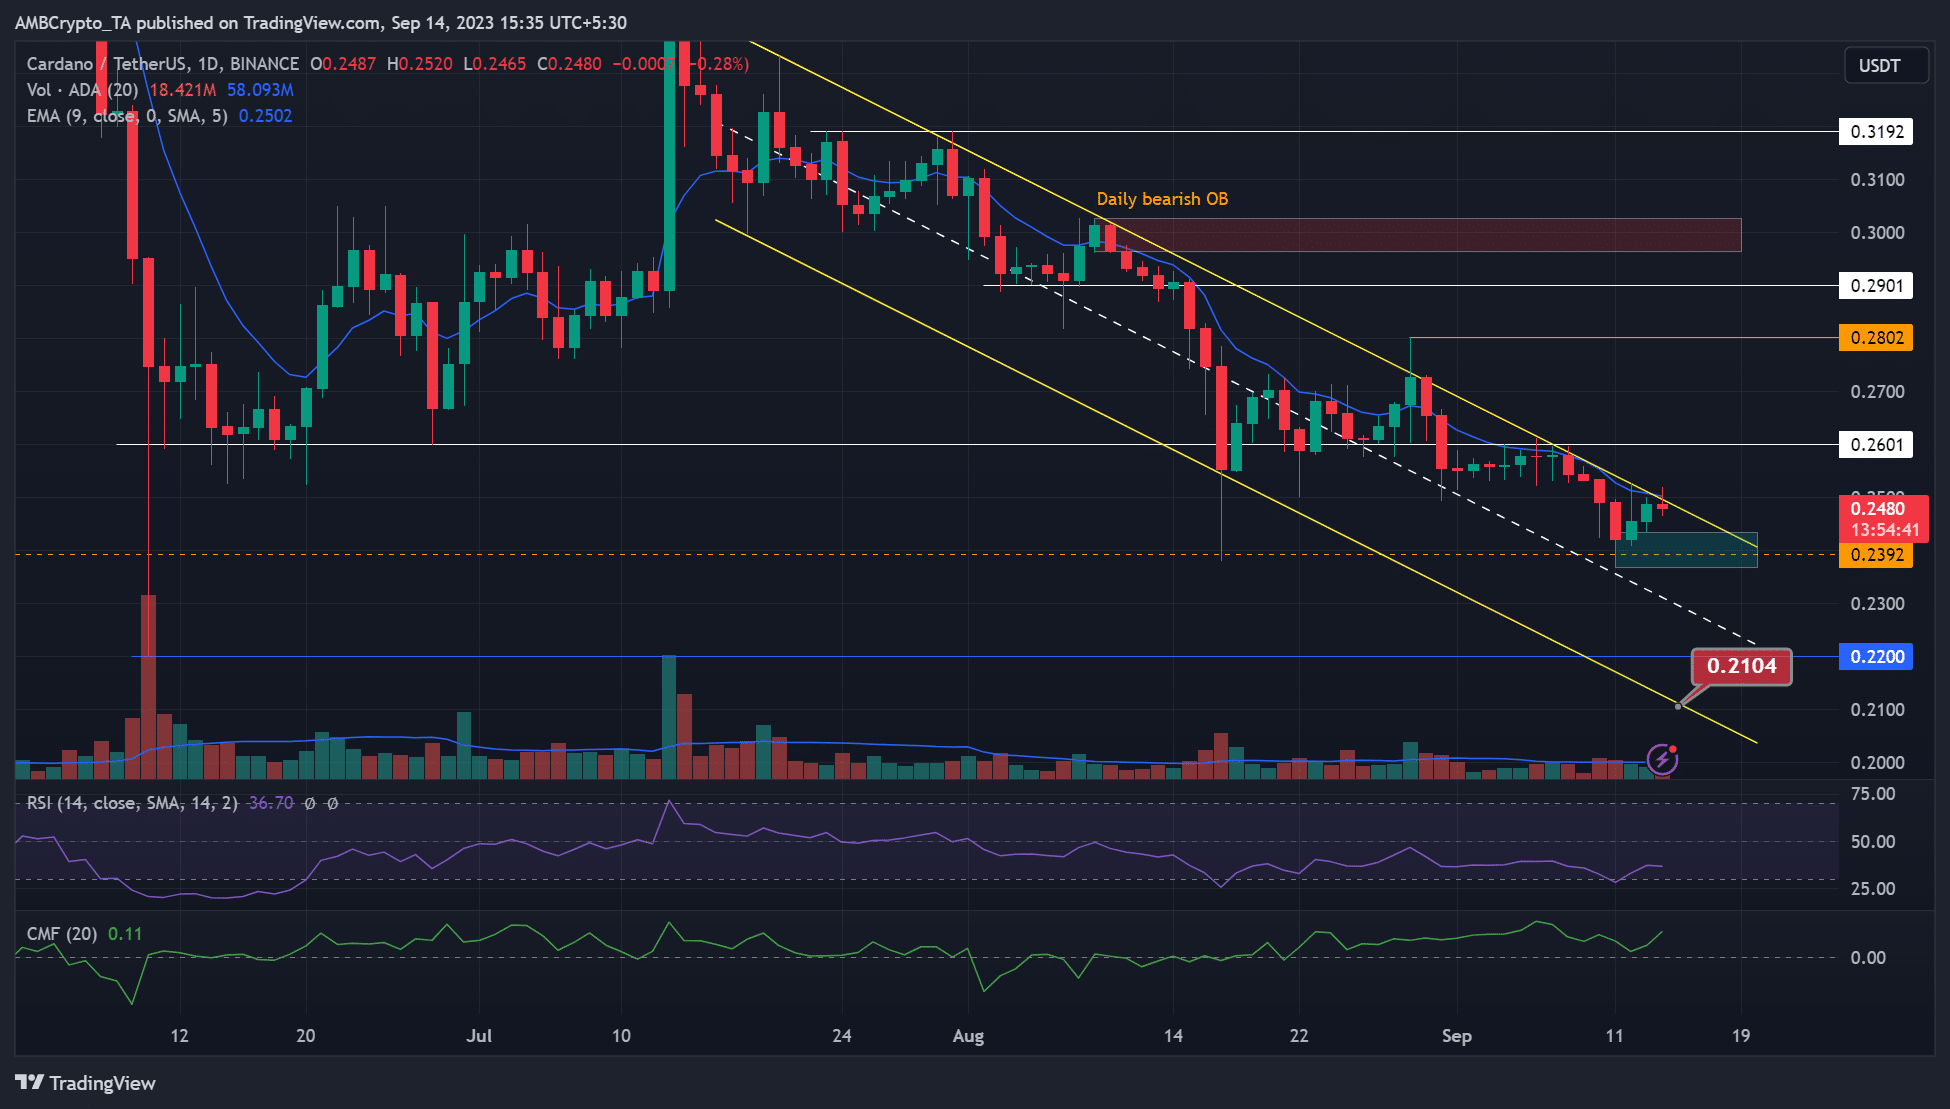
If you’re a Cardano [ADA] trader, you might have noticed the multi-month trendline resistance, especially on the higher timeframe. When captured using the parallel channel, the price action has steadily declined since mid-July.
Is your portfolio green? Check out the ADA Profit Calculator
At press time, the price action had bounced near the mid-range of $0.238, but sellers were betting against further upside beyond the range-high, as shown by the red candlestick.
Will sellers drive Cardano lower?
Since mid-July, ADA’s price action has faced price rejection at the range-high. If the trend persists, the press time price action could face the same fate.
Besides, the range-high of $0.2495 had a confluence with the 50-EMA (Exponential Moving Average) on the daily chart at press time. So, sellers could camp at the roadblock and force another decline to the H4 bullish order block of $0.2367 – $0.2433 (cyan), the mid-range or the range-low (near $0.21).
Conversely, a daily candlestick session close above the range-high and 50-EMA will reinforce a bullish intent. However, the daily market structure will only flip bullish if ADA exceeds $0.26. If so, the next target will be $0.28.
Meanwhile, the RSI has labored in the low range since August, demonstrating elevated sell pressure in Q3. On the contrary, the CMF reclaimed the zero mark in Septe
Go to Source to See Full Article
Author: Benjamin Njiri
Tip BTC Newswire with Cryptocurrency
Donate Bitcoin to BTC Newswire

Donate Bitcoin Cash to BTC Newswire

Donate Ethereum to BTC Newswire

Donate Litecoin to BTC Newswire

Donate Monero to BTC Newswire

Donate ZCash to BTC Newswire


