Shiba Inu’s (SHIB) price has fallen since December 17, 2023, when a diagonal resistance trend line rejected it.

SHIB trades below a horizontal support area and inside a short-term bearish pattern.

Shiba Inu Consolidates Below Resistance

The technical analysis of the daily time frame shows that SHIB has fallen since the resistance trend line of an ascending parallel channel rejected it on December 17, 2023 (red icon).

After initially bouncing above the $0.0000093 support area, SHIB broke down on January 22. SHIB validated it as resistance (red circle) on January 29 and has fallen since.
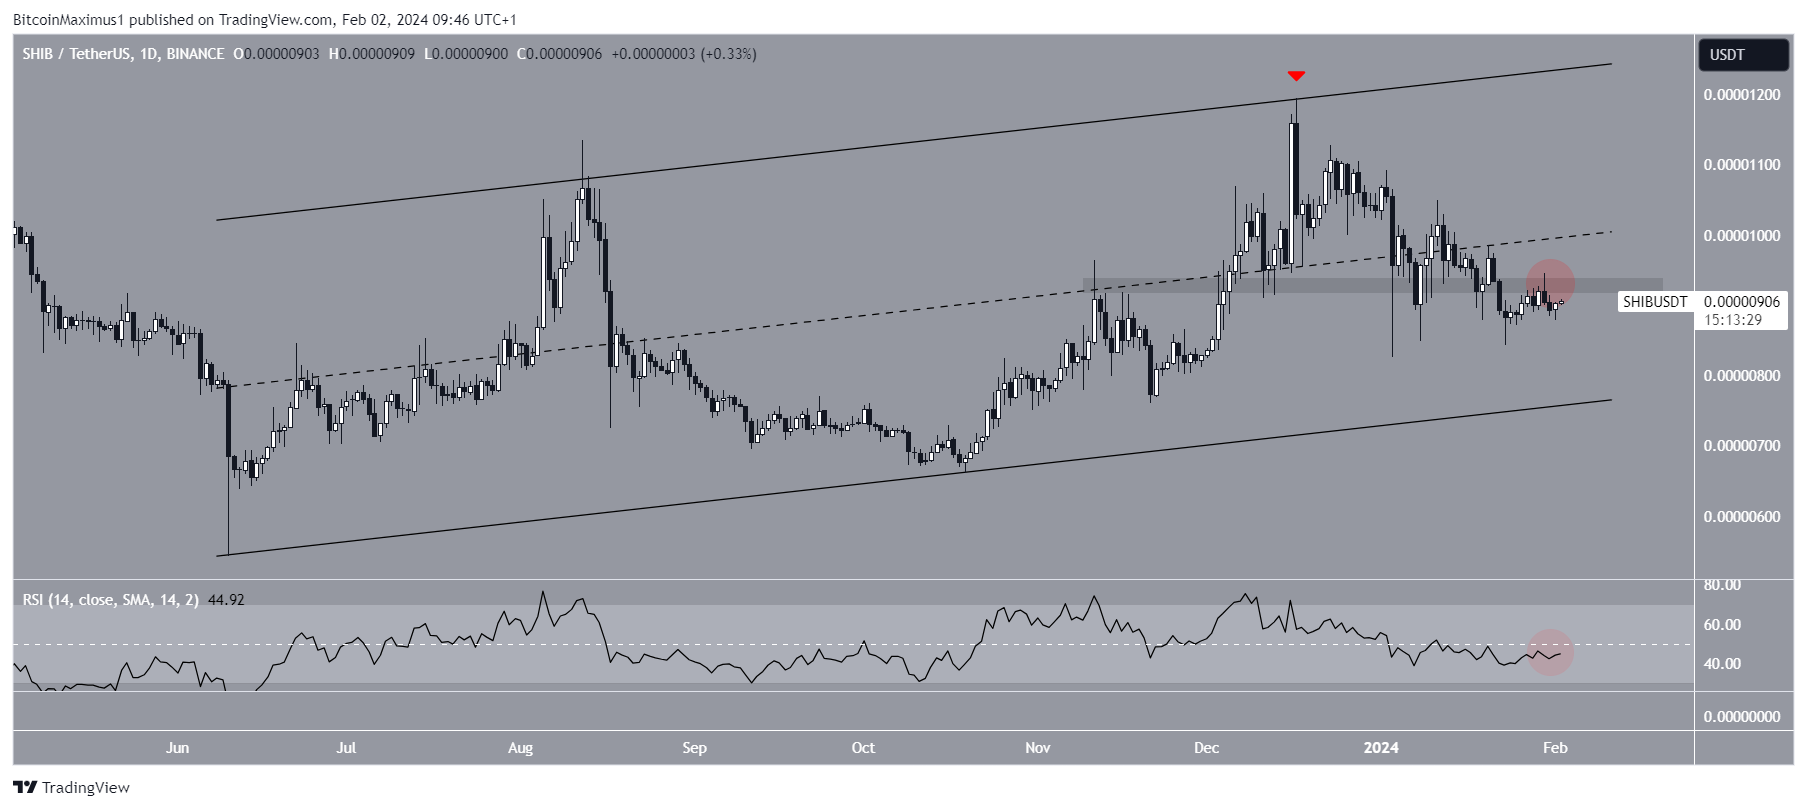
Shiba Inu (SHIB) Price Movement
SHIB/USDT Daily Chart. Source: TradingView

The daily Relative Strength Index (RSI) is bearish. When evaluating market conditions, traders use the RSI as a momentum indicator to determine whether a market is overbought or oversold and whether to accumulate or sell an asset.

Go to Source to See Full Article
Author: Valdrin Tahiri

Did you like this?
Tip BTC Newswire with Cryptocurrency

Donate Bitcoin to BTC Newswire

Scan to Donate Bitcoin to BTC Newswire
Scan the QR code or copy the address below into your wallet to send some bitcoin:

Donate Bitcoin Cash to BTC Newswire

Scan to Donate Bitcoin Cash to BTC Newswire
Scan the QR code or copy the address below into your wallet to send bitcoin:

Donate Ethereum to BTC Newswire

Scan to Donate Ethereum to BTC Newswire
Scan the QR code or copy the address below into your wallet to send some Ether:

Donate Litecoin to BTC Newswire

Scan to Donate Litecoin to BTC Newswire
Scan the QR code or copy the address below into your wallet to send some Litecoin:

Donate Monero to BTC Newswire

Scan to Donate Monero to BTC Newswire
Scan the QR code or copy the address below into your wallet to send some Monero:

Donate ZCash to BTC Newswire

Scan to Donate ZCash to BTC Newswire
Scan the QR code or copy the address below into your wallet to send some ZCash:

BTC NewswireAuthor posts

BTC Newswire Crypto News at your Fingertips

Comments are disabled.