Disclaimer: The information presented does not constitute financial, investment, trading, or other types of advice and is solely the writer’s opinion.
- TRON had a bullish structure on the higher timeframe price chart
- The slow move past the weekly chart’s resistance signaled bullish intent and long-term bulls can be confident in their conviction
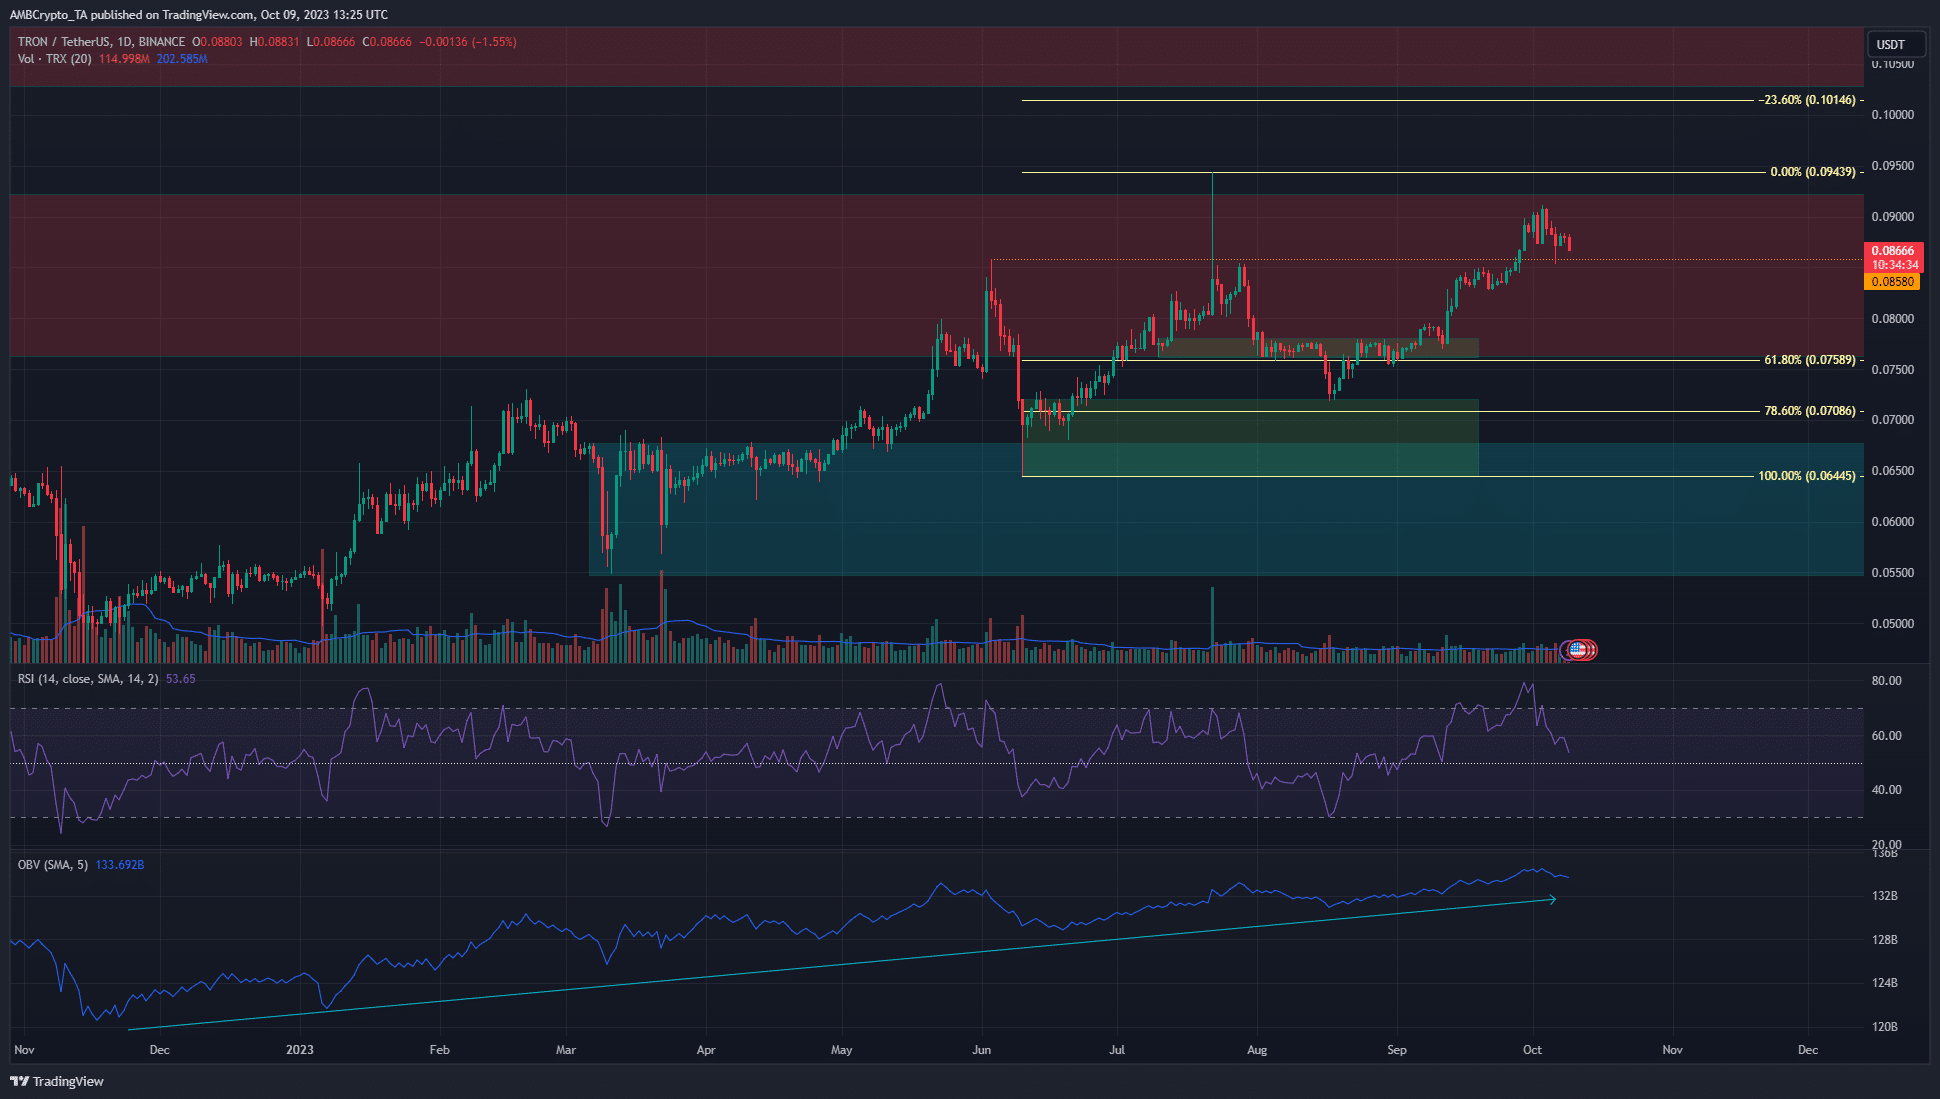
TRON [TRX] was in a strong uptrend on the one-day chart. It has slowly but steadily worked its way past the $0.08-$0.09 band of resistance and showed good prospects of making further gains.
Is your portfolio green? Check the TRON Profit Calculator
A recent report from AMBCrypto dated 8 October noted that TRON’s technical indicators leaned bearish. A pullback to $0.085 support has been in progress for a week. This key level could dictate whether TRX can rally higher this week, and Bitcoin’s [BTC] price movement could influence TRX’s path.
The bulls need to defend $0.0858 to keep hold of the gains made late in September
The price report pointed out that a drop below $0.085 could see TRX retrace to $0.082. This was a higher low on the daily chart that TRX posted on 21 September. A move below this level would shift the currently bullish market structure to bearish.
The On-balance Volume (OBV) has been in a steady uptrend throughout 2023. It was interspersed with deep pullbacks, just like the price. It was likely that this trend would continue. The Fibonacci extension levels (pale yellow) showed that the next target was the $0.101 level, the 23.6% extension. These levels were plotted using the rallies that oc
Go to Source to See Full Article
Author: Akashnath S
Tip BTC Newswire with Cryptocurrency
Donate Bitcoin to BTC Newswire

Donate Bitcoin Cash to BTC Newswire

Donate Ethereum to BTC Newswire

Donate Litecoin to BTC Newswire

Donate Monero to BTC Newswire

Donate ZCash to BTC Newswire


