Disclaimer: The information presented does not constitute financial, investment, trading, or other types of advice and is solely the writer’s opinion.
- TRON has a bullish structure on the daily chart.
- The higher timeframe resistance near $0.085 could cause problems for the bulls.
TRON [TRX] posted some gains on the price chart over the past week. It rallied from $0.077 on 11 September to reach $0.0845 on 16 September, a bounce that measured 8.91%. It came alongside a Bitcoin [BTC] bounce from $25.9k to $26.8k.
Is your portfolio green? Check the TRX Profit Calculator
The network recorded impressive growth in recent weeks and reached the 4.8 million daily transactions milestone. Developments in 2023 meant that we could see a surge in organic demand for TRX, which can benefit holders massively in the long run. But is this sentiment reflected in the price charts?
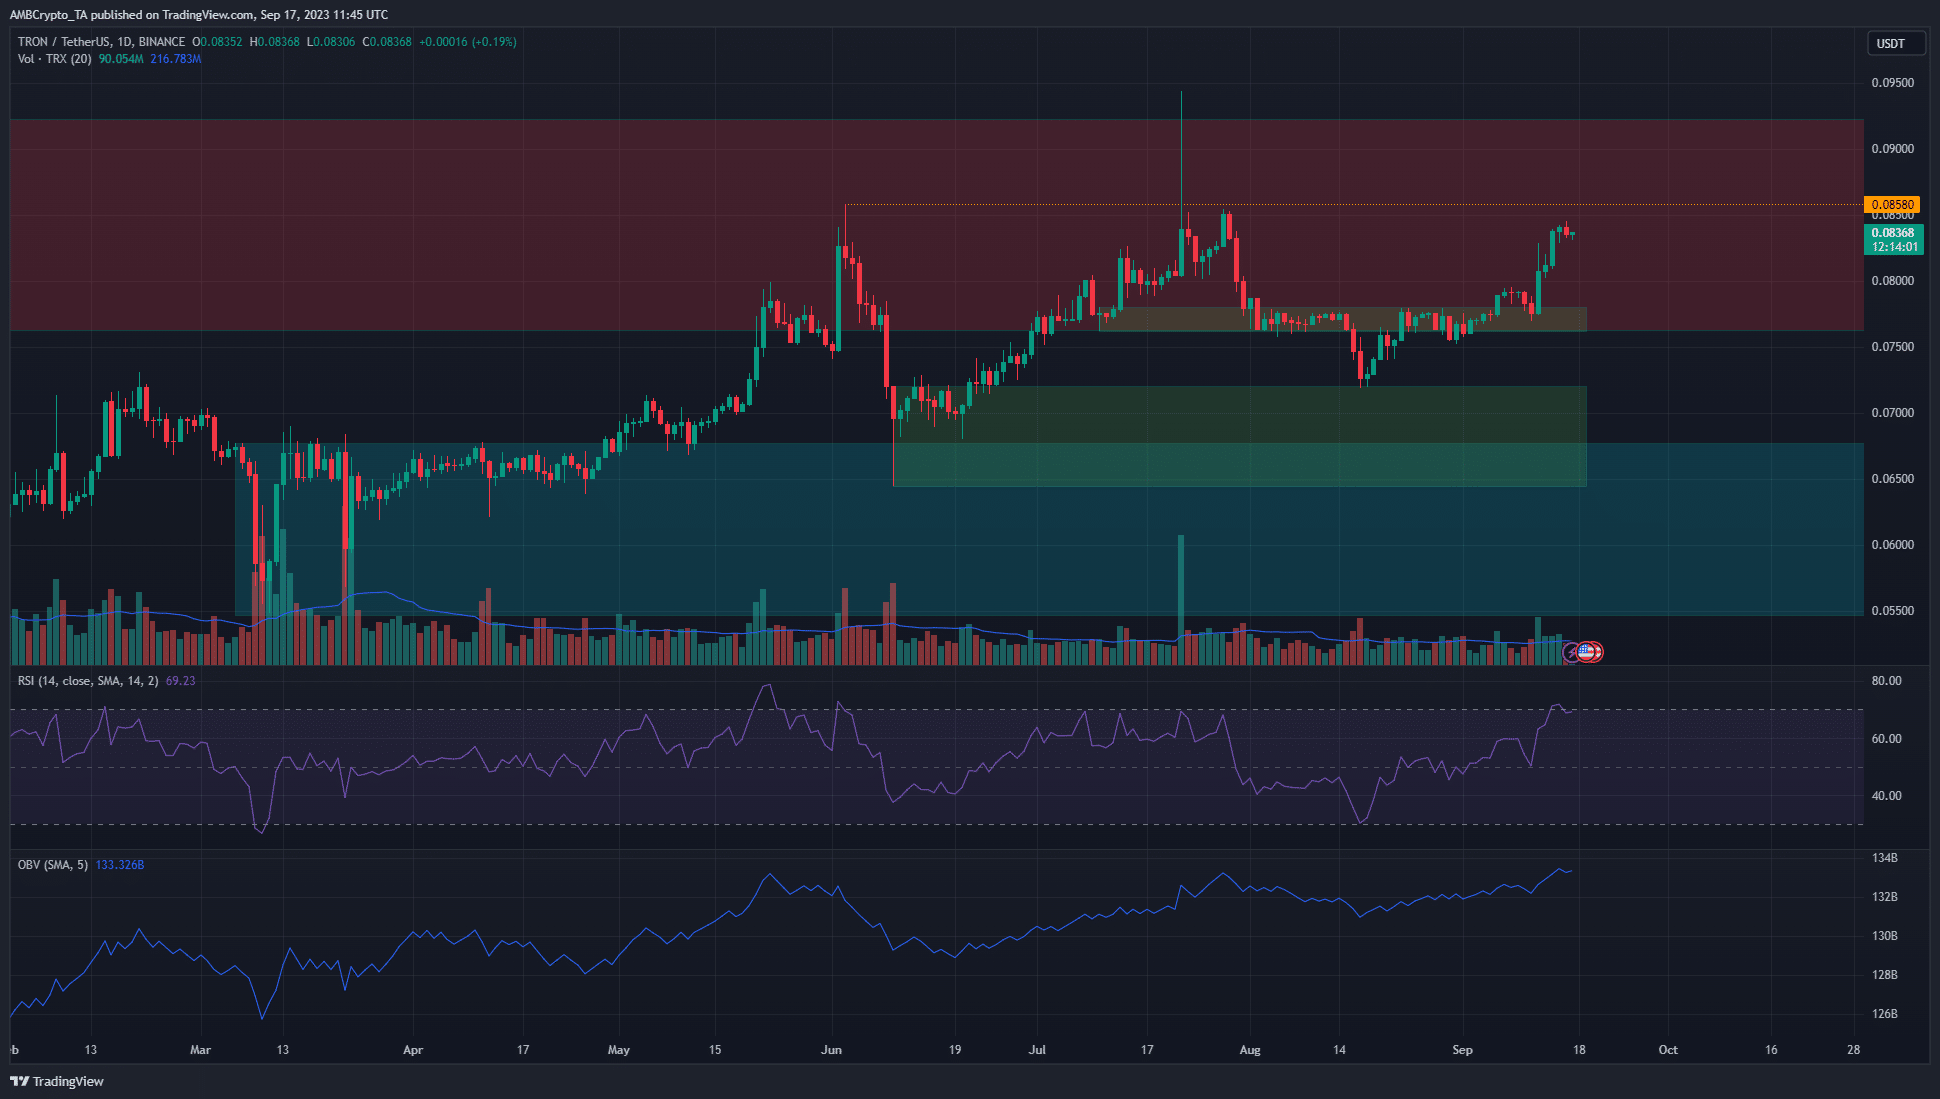
TRX was trading within a higher timeframe resistance zone
At press time, TRX was valued at $0.08368. On the 1-day chart above, the red box represented a bearish order block from the weekly timeframe that was formed in late May 2022. This region extended from $0.076-$0.092.
The daily timeframe noted three rejections at the $0.0858 (dotted orange) resistance level in the past three months. Therefore, despite the bullish market structure of TRX on the D1 chart, it is likely that we will see another rejection at the resistance.
The RSI was at 69 and showed strong bullish momentum, in agreement with the price action structure. The OBV was in an uptrend as well. This trend stretched back to mid-March a
Go to Source to See Full Article
Author: Akashnath S
Tip BTC Newswire with Cryptocurrency
Donate Bitcoin to BTC Newswire

Donate Bitcoin Cash to BTC Newswire

Donate Ethereum to BTC Newswire

Donate Litecoin to BTC Newswire

Donate Monero to BTC Newswire

Donate ZCash to BTC Newswire


