- TRX delivers some sideways price action as sell pressure fades.
- Tron’s latest announcement underscores the potential for more Dapp development.
The last time we looked into TRX’s performance we observed that it had embarked on a retracement. TRX bears are now slowing down but will the bears take advantage or is this a pause before giving in to more downside?
Is your portfolio green? Check out the Tron Profit Calculator
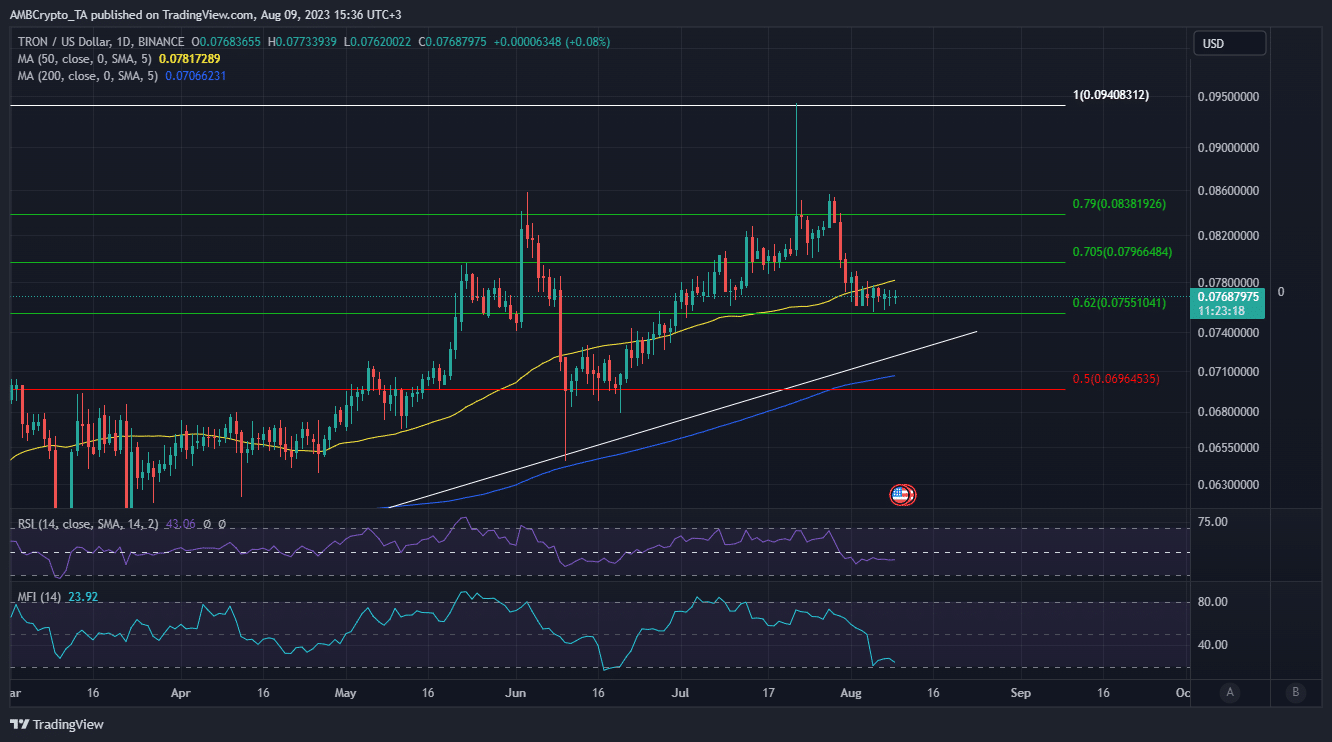
TRX bottomed out at $0.075 in the first week of August. This new bottom range represented almost a 20% dip from its $0.094 in July. While this price drop represented a significant discount, there are days where prices dip or rally by higher margins even in a day.
Bearish dominance has been showing signs of a slowdown in the last few days judging by the sideways price action. TRX traded at $0.076 at the time of writing. Some key observations align with the slowdown in sell pressure.
For example, the price appears to have found support at the 0.62 Fibonacci retracement level.
Previous Fibonacci retracement levels have shown a high probability of yielding a pivot. So will this be the case with TRX at its current price level? Well, its Money Flow Index (MFI) recently curbed its downside as well. However, it also doesn’t indicate a bullish accumulation.
On-chain data revealed that there were some bullish expectations in the last few days as selling pressure tapered out. The weighted sentiment metric shot up between 6 and 7 August but then again we also saw a surge in negative funding rates. This suggested that there was a surge in short positions, hence the bearish expectations.
Author: Michael Nderitu
Tip BTC Newswire with Cryptocurrency
Donate Bitcoin to BTC Newswire

Donate Bitcoin Cash to BTC Newswire

Donate Ethereum to BTC Newswire

Donate Litecoin to BTC Newswire

Donate Monero to BTC Newswire

Donate ZCash to BTC Newswire


