- TON formed an inverse head and shoulders pattern on the daily chart.
- Negative exchange Netflow indicated a possible upward shift, but mixed signals still cloud the market’s direction.
The past week has been turbulent for Toncoin [TON], with a 9.26% drop in market price. While signs of recovery are emerging, progress has been minimal, with a modest 0.52% gain in the last 24 hours.
Despite the lackluster performance, there remains a glimmer of optimism as AMBCrypto notes the potential for positive momentum ahead.
Bullish potential for TON
At press time, TON has formed an inverse head and shoulders pattern, a classic signal of potential bullish momentum.
As shown on the chart, the pattern consists of three peaks: a left shoulder, a higher head, and a lower right shoulder.
A bullish confirmation typically occurs when the price breaks above the neckline, which connects the two troughs between the shoulders.
Currently, TON has yet to breach the neckline. Once it does, it would confirm the bullish trend, with a potential price target of $5.804, if not, then it can fall to its October low of $5.139 or lower.
Source: Trading View
However, assessing on-chain metrics is important to determine whether a breakout is imminent.
Metrics suggest uncertainty
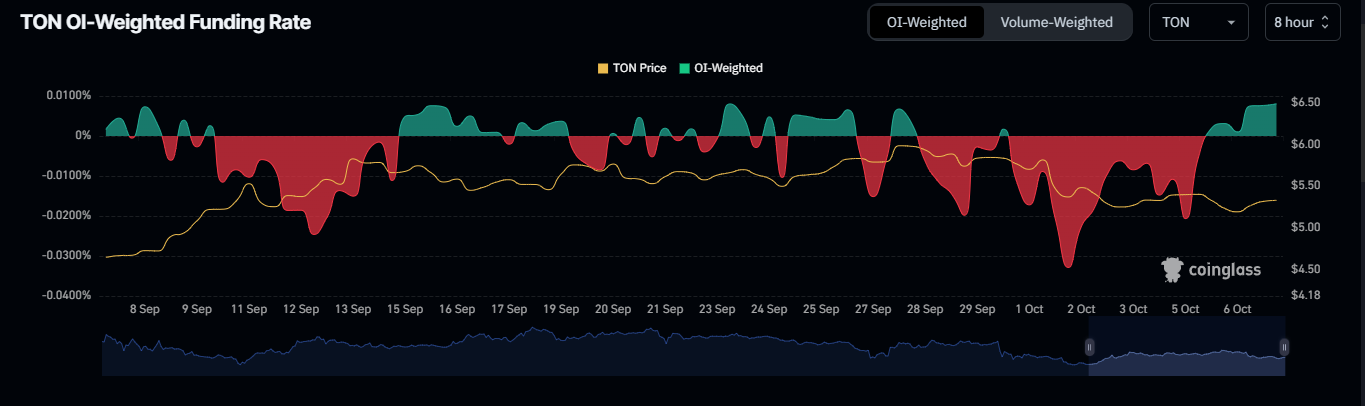
According to Coinglass, the OI-Weighted Funding Rate has remained positive, sitting at 0.0080% at press time, indicating bullish sentiment in the market.
The OI-Weighted Funding Rate combines Open Interest and Funding Rates to assess market sentiment and the cost of holding long or short positions in derivatives.