
The Polygon (MATIC) price has increased during the last five weeks, nearly reaching a high of $1 today.
MATIC has reached a nearly 700-day descending resistance trend line. Will it break out?
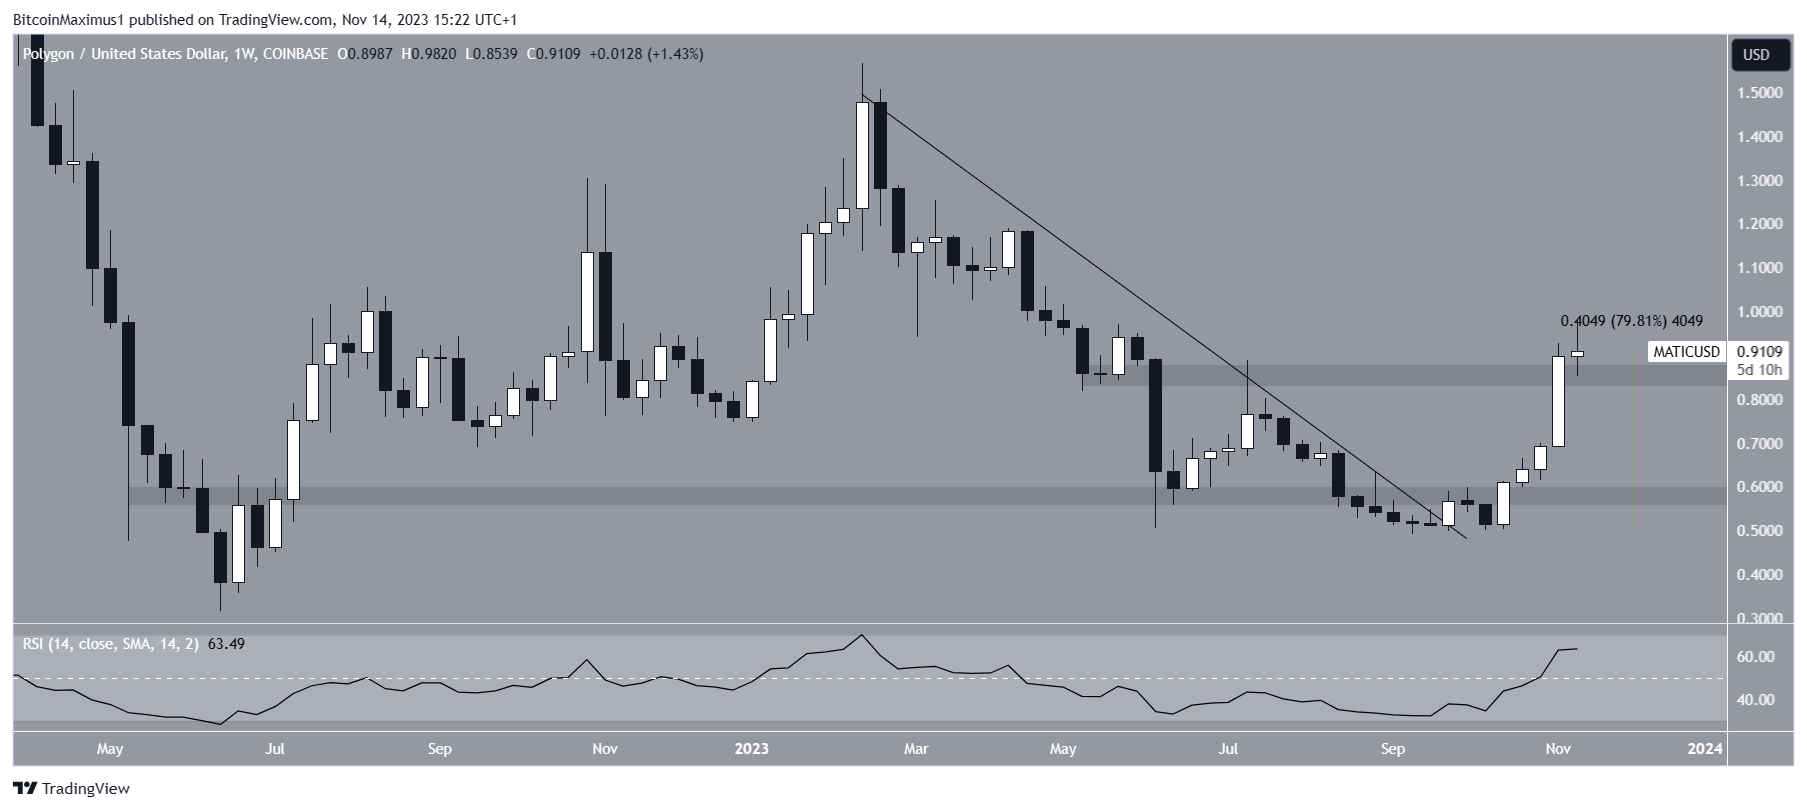
MATIC Clears Long-Term Resistance
The weekly time frame technical analysis reveals that the MATIC price is in the process of creating its fifth consecutive bullish weekly candlestick.
During this time, the MATIC price increased by 85% and reclaimed the $0.60 and $0.85 horizontal areas.
A breakout from a long-term descending resistance trend line preceded the entire upward movement.
Read more: Polygon (MATIC) Price Prediction
The weekly Relative Strength Index (RSI) functions as a momentum indicator, aiding traders in evaluating a market’s overbought or oversold status to inform their buy or sell decisions.
A reading above 50 during an upward trend favors bullish sentiment, while a reading below 50 suggests the opposite. Currently, the RSI is on the rise and has surpassed 50, indicating a bullish trend.
Go to Source to See Full Article
Author: Valdrin Tahiri
Tip BTC Newswire with Cryptocurrency
Donate Bitcoin to BTC Newswire

Donate Bitcoin Cash to BTC Newswire

Donate Ethereum to BTC Newswire

Donate Litecoin to BTC Newswire

Donate Monero to BTC Newswire

Donate ZCash to BTC Newswire


