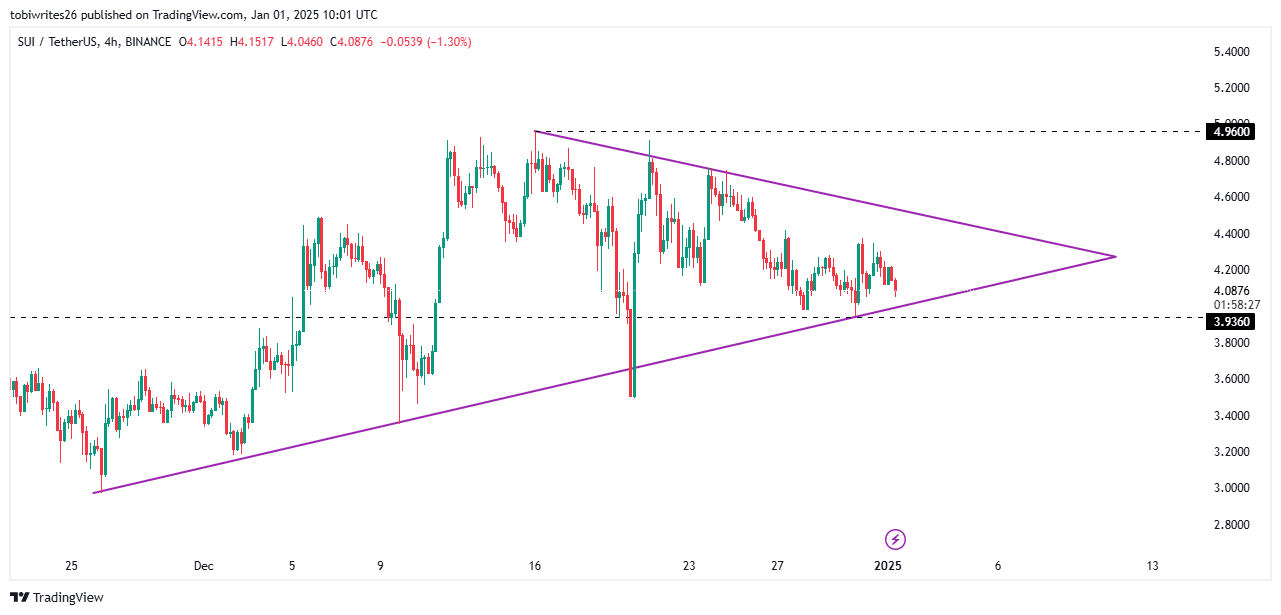
- SUI was trading within a symmetrical triangle pattern, with a key support level to provide a potential base for upward momentum.
- A slight dip remains possible as the coin sought stronger support before resuming its bullish trajectory.
Over the past 24 hours, SUI has declined by 4.89%, suggesting further downside risk in the short term. Despite this, the asset’s monthly gain of 24.75% highlights its broader bullish trend.
Based on technical indicators and on-chain data, SUI may soon break out of its current range and rally toward a higher price zone, potentially reaching $4.96 in the near term.
SUI trades within a symmetrical channel
On the 4-hour chart, SUI appears to have entered an accumulation phase and is forming a symmetrical triangle. This pattern suggests market participants are buying at lower levels, which could lead the market to swing higher.
This phase is characterized by two converging trendlines: the upper line as resistance and the lower as support. For a rally, SUI might need to drop to establish sufficient support at two key levels.
First, SUI could test the support on the lower trendline. Alternatively, it might decline further to a historical level of 3.926, which could trigger a move to the $4.96 level. Beyond that, the price will likely trend higher.
Source: TradingView
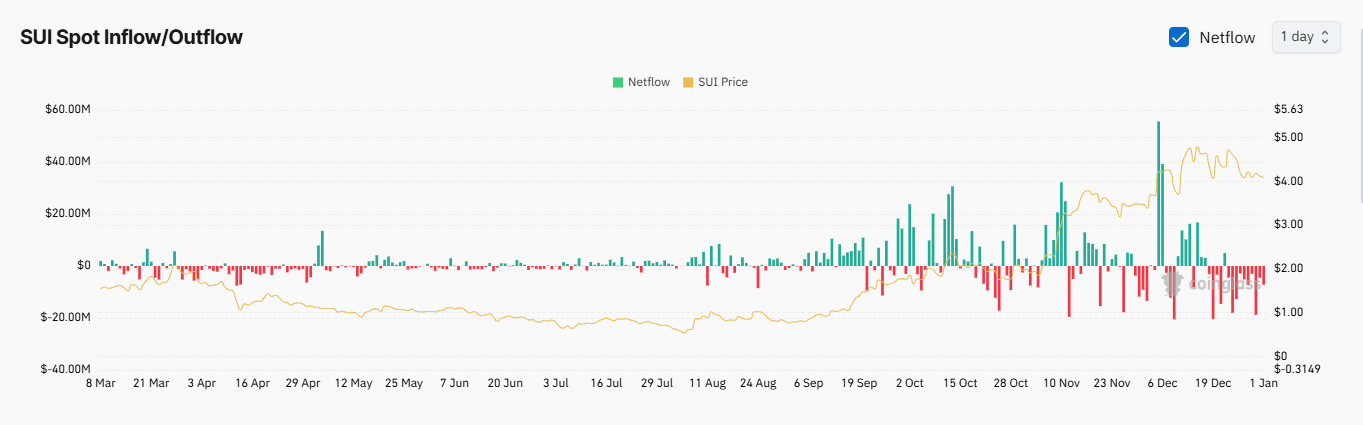
Currently, the bullish momentum is supported by a continued negative net outflow, as recorded by the Exchange Netflow metric on Coinglass. Negative net flow, where more assets leave exchanges than enter, often positively impacts the price.
Approximately $26 million worth of SUI has been withdrawn from exchanges, with $7.11 million withdrawn in the past 24 hours.
Go to Source to See Full Article
Author: Olayiwola Dolapo