Disclaimer: The information presented does not constitute financial, investment, trading, or other types of advice and is solely the writer’s opinion.
- The structure was neutral on the daily chart at press time.
- About $1.2 million worth of long positions liquidated in the past 24 hours.
Solana [SOL] witnessed price fluctuations in April, and May wasn’t on a good start either. On 9 April, SOL inflicted a rally, appreciating by 30% from $20 to $26.
Is your portfolio green? Check SOL Profit Calculator
But the price rejection at the $26 resistance level led to retracement, clearing all the gains. Bulls’ attempts at recovery were thwarted at press time, as SOL witnessed downward pressure that could set it to retest the support level of $20.
Meanwhile, crypto markets could witness elevated volatility in the first week of May due to the FOMC meeting on 2-3 May. As such, macro traders should track key SOL levels during this period.
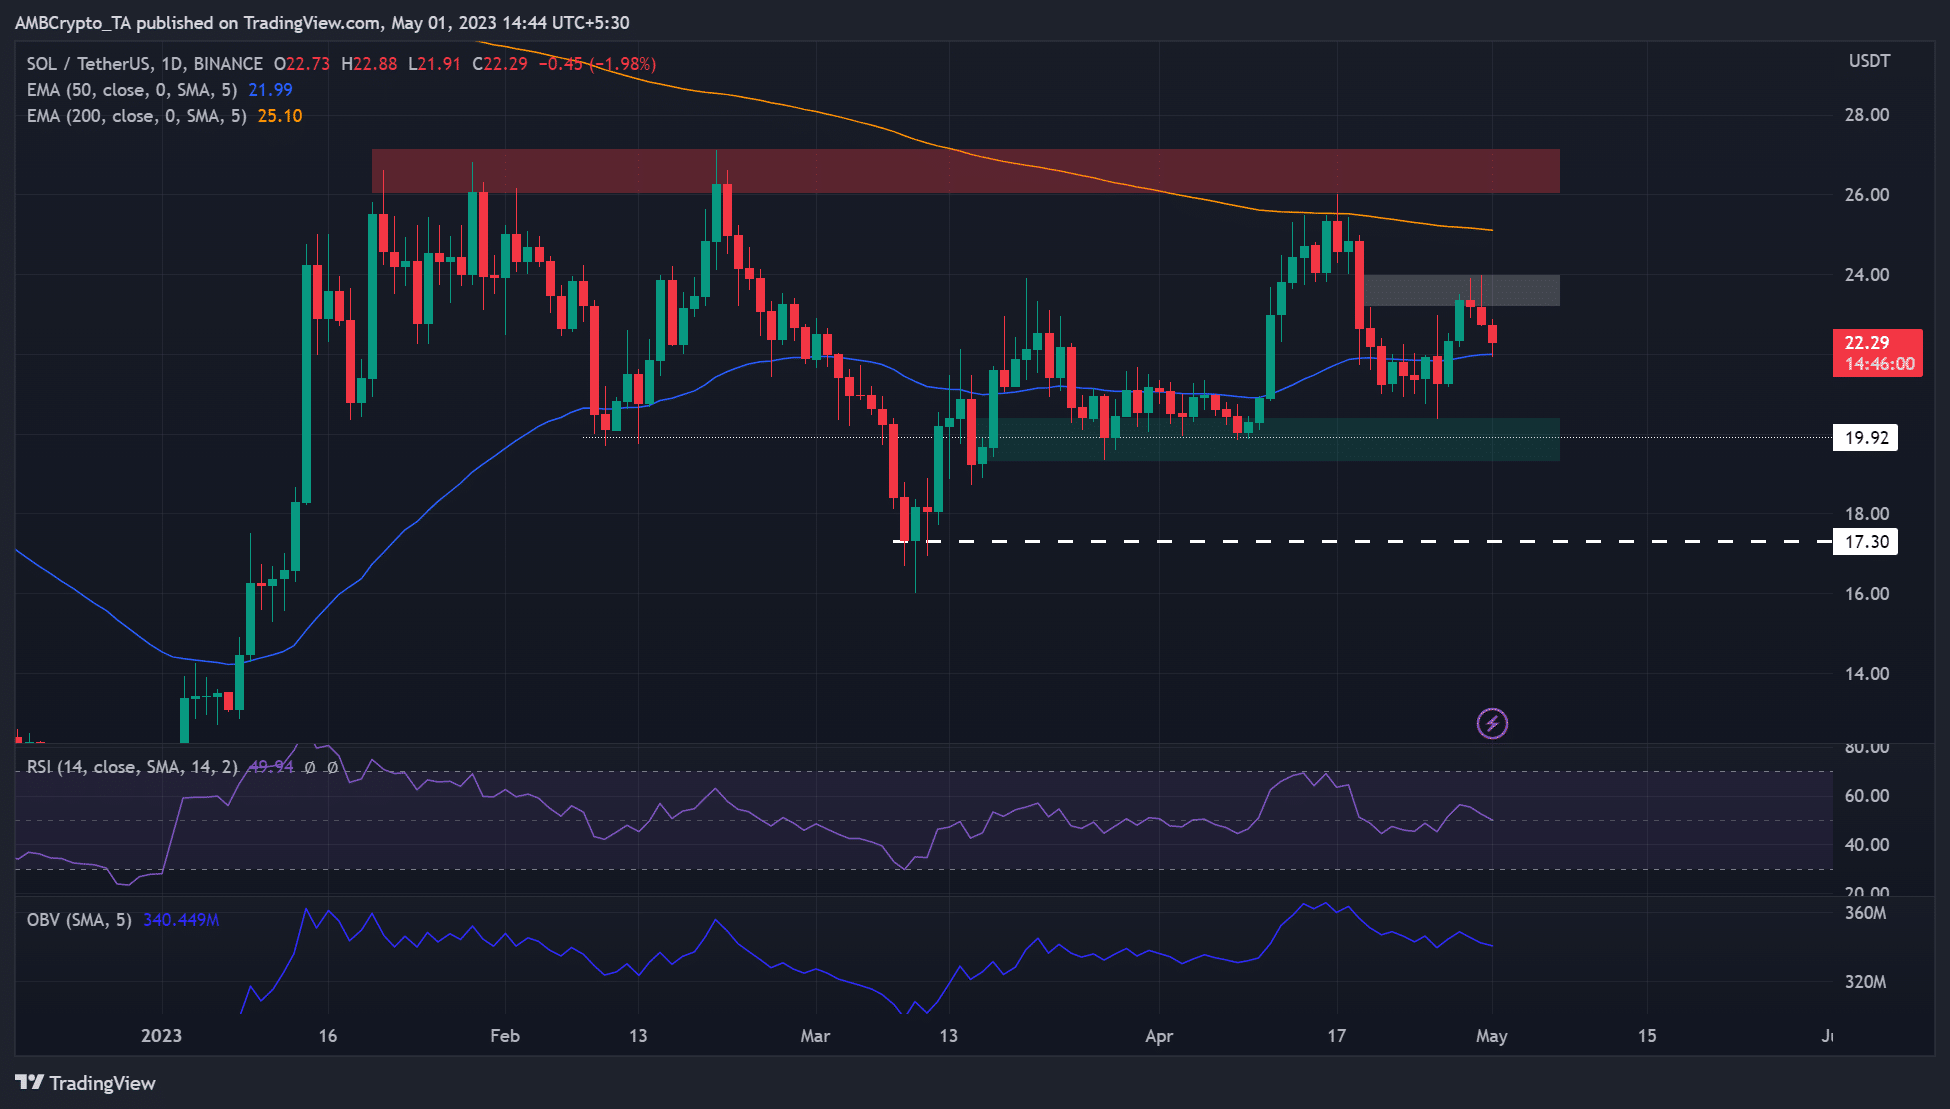
Sellers are keen to sink SOL below 50-EMA
Price action oscillated between $20 and $23.9 in late March. But in April, price action fluctuated between $20 and $26. Notably, the $19.92 is a key bullish order block on the daily chart that has prevented further drops since late March.
The recovery inflicted in late April hit an FVG (fair value gap) of $23.19 -$23.98 (white), stalling bulls’ efforts. At press time, sellers were keen on pushing SOL below the 50-EMA ($21.99) (blue line).
If sellers clear the hurdle, SOL could drop to the support around $20 and attempt another recovery. If the $20 support cracks, the SOL/USDT pair could drop to $17.30.
On the other hand, a close above the FVG zone could of
Go to Source to See Full Article
Author: Suzuki Shillsalot
Tip BTC Newswire with Cryptocurrency
Donate Bitcoin to BTC Newswire

Donate Bitcoin Cash to BTC Newswire

Donate Ethereum to BTC Newswire

Donate Litecoin to BTC Newswire

Donate Monero to BTC Newswire

Donate ZCash to BTC Newswire


