
The Solana (SOL) price broke down from an ascending support trend line that was in place for nearly 100 days.
SOL also broke down from a short-term symmetrical triangle, falling below a Fibonacci support area.
Solana Breaks Down From Long-Term Resistance
The technical analysis from the daily time frame shows that SOL has increased alongside an ascending support trend line since October 16, 2023. The increase led to a high of $126 on December 25. This was a new yearly high.
However, the SOL price has fallen since. On January 19, 2024, it broke down from the ascending support trend line. At the time, the trend line had been in place for 96 days. Currently, SOL trades inside the 0.382 Fib retracement support level.
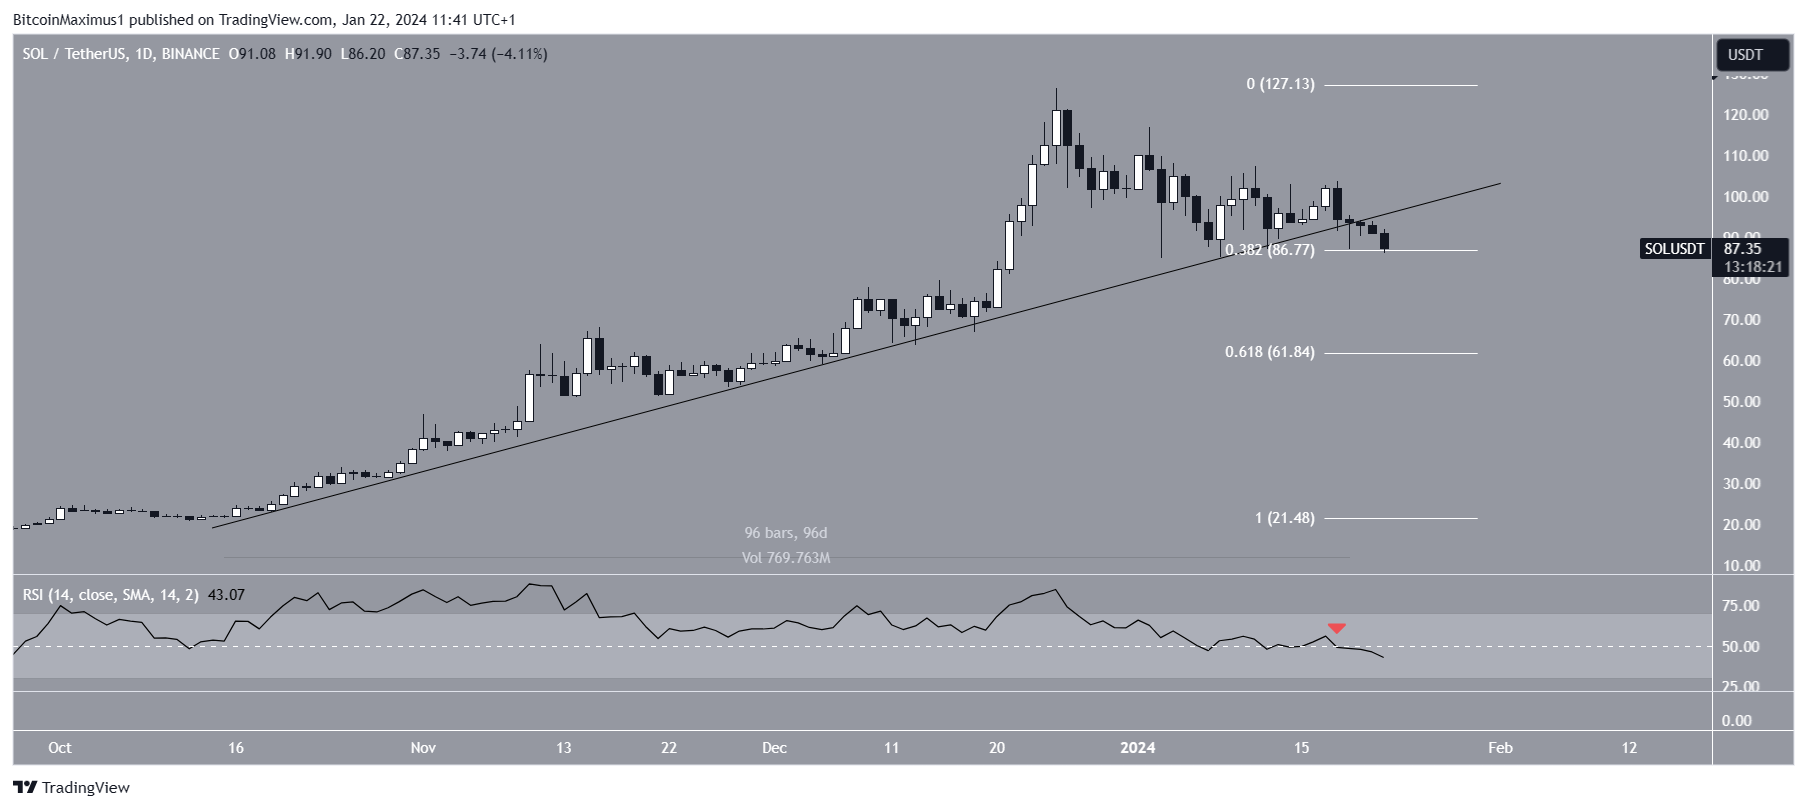
The daily RSI gives a bearish reading. When evaluating market conditions, traders use the RSI as a momentum i
Go to Source to See Full Article
Author: Valdrin Tahiri
Tip BTC Newswire with Cryptocurrency
Donate Bitcoin to BTC Newswire

Donate Bitcoin Cash to BTC Newswire

Donate Ethereum to BTC Newswire

Donate Litecoin to BTC Newswire

Donate Monero to BTC Newswire

Donate ZCash to BTC Newswire


