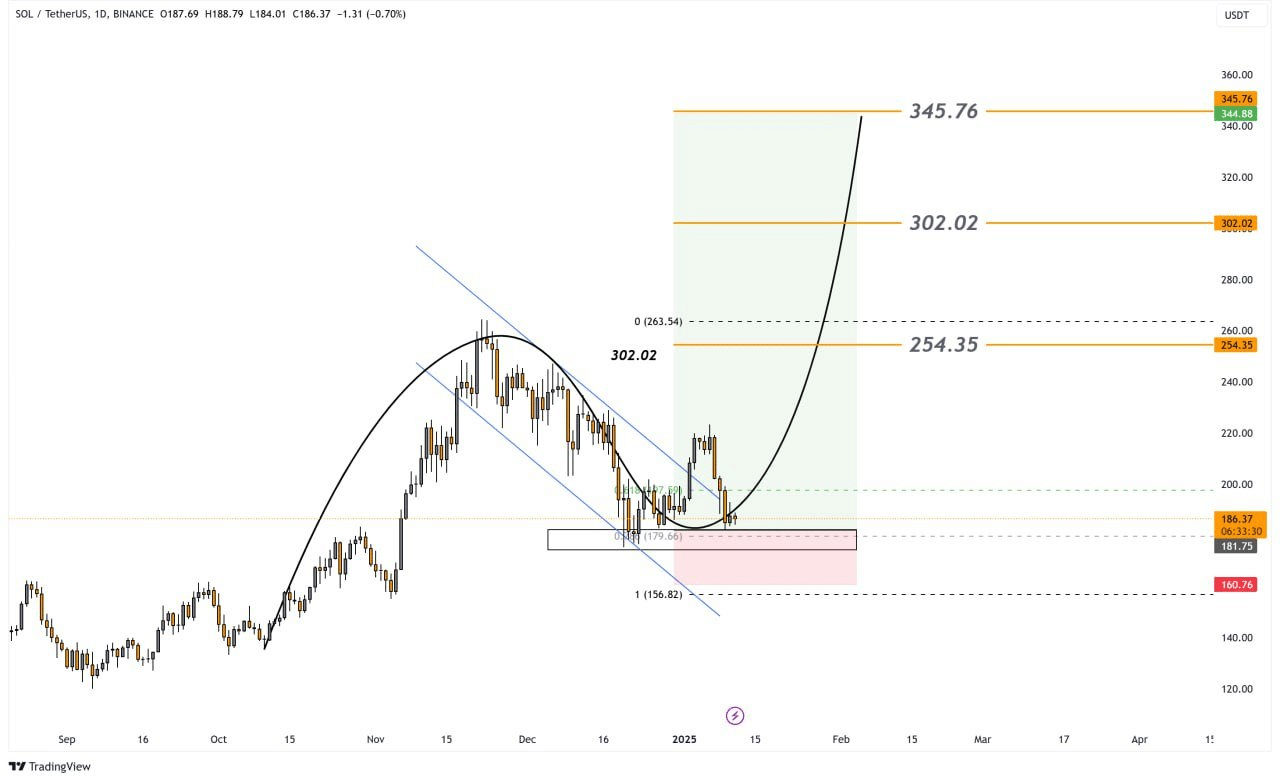
- Solana’s price action has seen a strong recovery from the key support level of $179.66, a point well-aligned with the 61.8% Fibonacci retracement zone
- Solana’s technical and fundamental indicators alluded to a promising bullish rally
Solana (SOL) has been grabbing the attention of traders with its remarkable V-shaped recovery in recent weeks. Its recent price action demonstrated resilience, with critical levels of support and potential bullish targets aligning with technical indicators.
Key support and Fibonacci Retracement levels
Solana’s price action has seen a strong recovery from its key support level of $179.66, a point well-aligned with the 61.8% Fibonacci retracement zone – A critical area for identifying trend reversals.
Historically, this retracement level often acts as a magnet for buyers when bearish pressure begins to fade.
The altcoin’s recent bounce from this level not only validates the support zone, but also positions Solana for significant upward movement towards the bullish targets at $254.35, $302.02, and $345.76 – In alignment with the Fibonacci extensions.
Looking at Solana’s overall market structure, the presence of higher lows following the recovery suggests renewed buyer interest. This seemed to point to potential momentum for a breakout, if the current trajectory holds.
Therefore, SOL may hold the $179.66 level as support, as a break below could invalidate this bullish setup. If market sentiment remains favorable, Solana could move towards its first target of $254.35 within the coming weeks.
MVRV Ratio analysis
At the time of writing, Solana’s MVRV ratio seemed to point to a recovery phase, suggesting that most investors who entered during prior accumulation phases are now either at break-even or slightly in profit.
Author: Clinton Otieno