Disclaimer: The information presented does not constitute financial, investment, trading, or other types of advice and is solely the writer’s opinion.
- Solana bulls fought desperately to defend a higher timeframe support zone.
- A slump below $20 could see another 15% fall for SOL.
Solana [SOL] saw a strong wave of selling in mid-August. This bearish sentiment also swept across the rest of the crypto sphere and saw a plunge in prices. Its NFT space was performing well. A recent report highlighted a surge in sales volume a few days ago. However, the sentiment on the price chart leaned in favor of the bears.
Is your portfolio green? Check the Solana Profit Calculator
SOL was trading within a higher timeframe area of interest. It would be vital for the bulls to defend the $20 area and shift the market structure bullish on the lower timeframes with a move past $22.
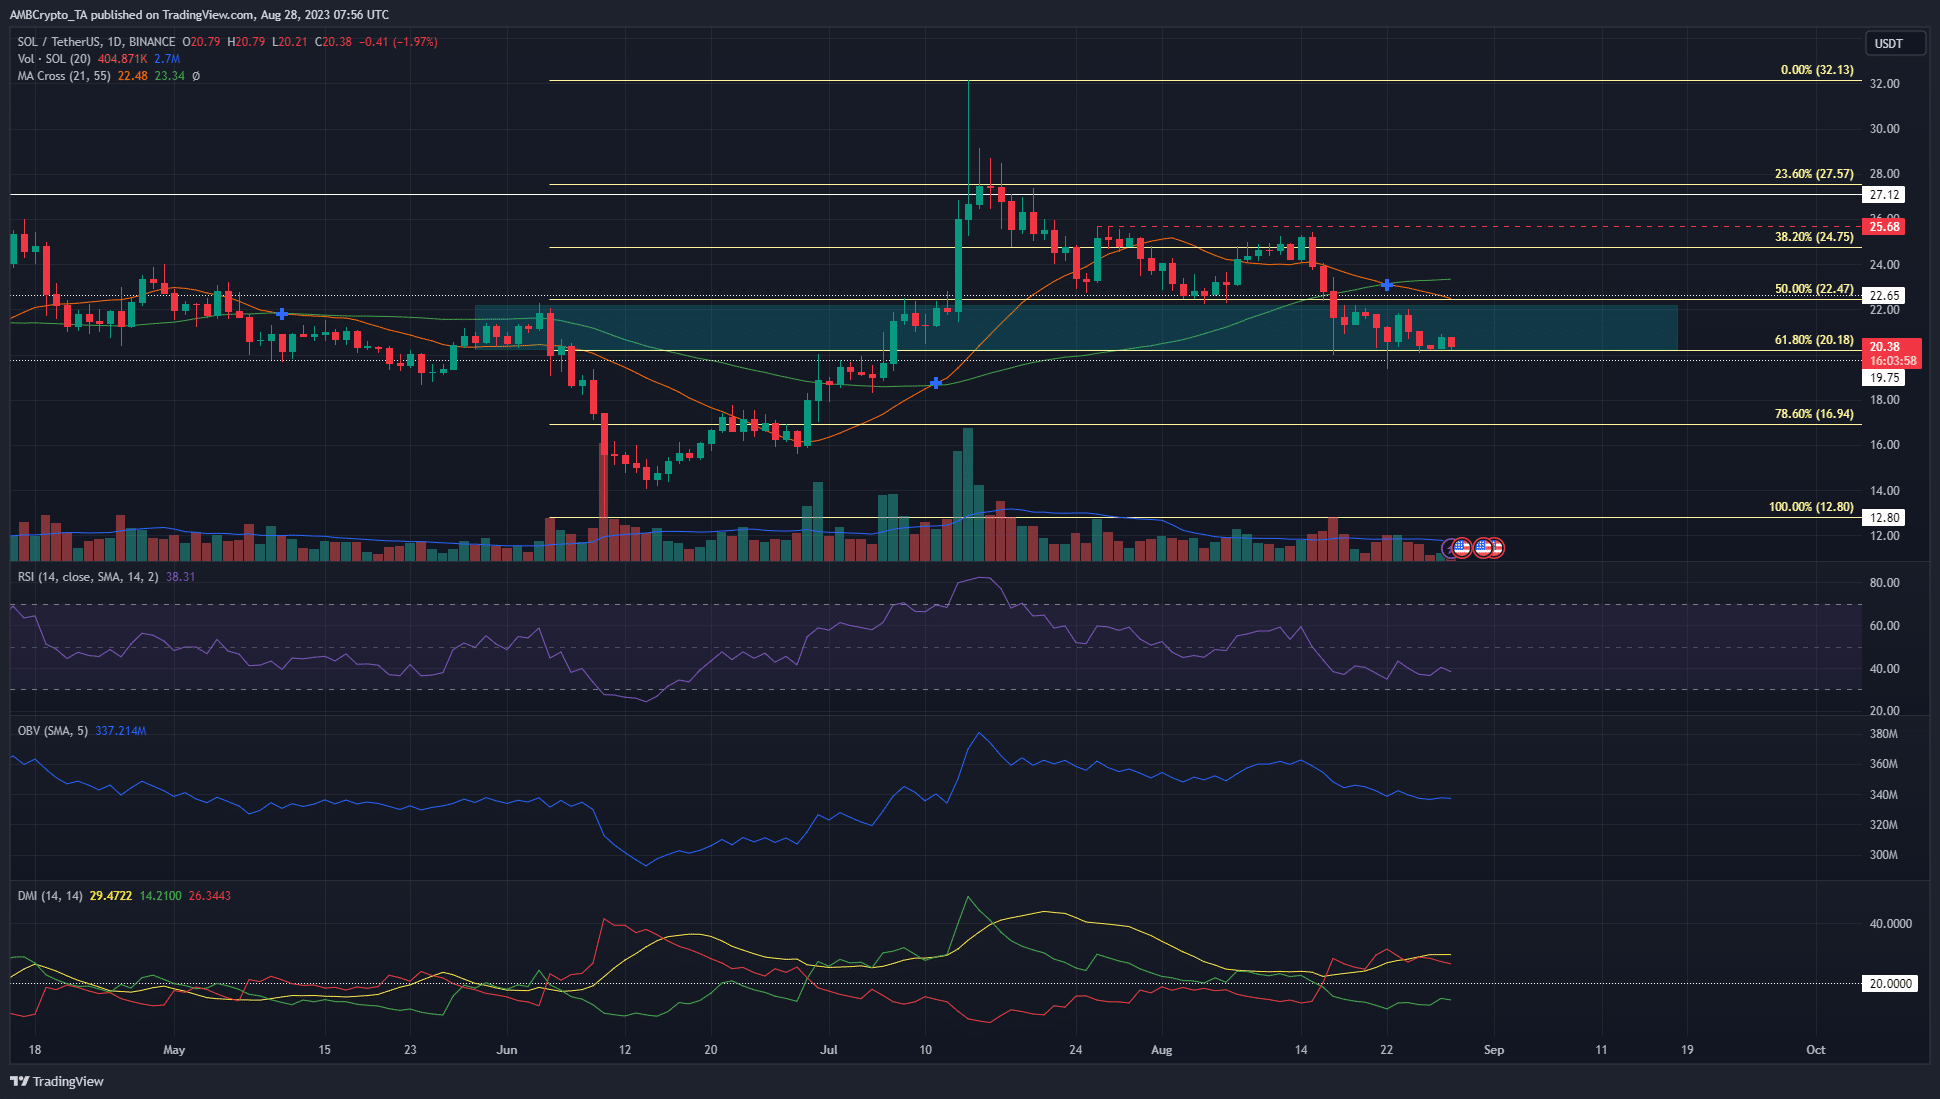
A drop below $20.2 could see SOL prices fall to $17
The$20.26-$22.3 area was highlighted in cyan to demarcate a bullish breaker block from the 1-week timeframe. The 1-day chart showed that the market structure has been bearish since early August and that SOL was in a downtrend. The simple moving averages and the RSI also reinforced the idea of bearish momentum.
The DMI showed a strong downward trend on the daily chart with both the -DI (red) and ADX (yellow) above the 20 mark, which corroborated the inference from the price chart. The OBV has also slowly declined over the past two weeks.
The Fibonacci retracement levels (pale yellow) showed that the 61.8% and 78.6% levels at $20.18 and $16.94 could serve as support. However, a daily session close below $20.26 would breach the weekly breaker block and signal bearis
Go to Source to See Full Article
Author: Akashnath S
Tip BTC Newswire with Cryptocurrency
Donate Bitcoin to BTC Newswire

Donate Bitcoin Cash to BTC Newswire

Donate Ethereum to BTC Newswire

Donate Litecoin to BTC Newswire

Donate Monero to BTC Newswire

Donate ZCash to BTC Newswire


