Disclaimer: The information presented does not constitute financial, investment, trading, or other types of advice and is solely the writer’s opinion.
- The H12 market structure of SOL was bearish.
- The two resistances overhead can stall the bulls later in May.
Solana [SOL] saw increased network usage after transaction fees heightened on Ethereum [ETH] and Bitcoin [BTC]. Yet, despite the influx of users, other metrics such as TVL were in a downtrend. The prices also followed the same path.
Read Solana’s [SOL] Price Prediction 2023-24
The 4-hour chart showed a strong confluence of resistance at $21.8-$22.5. A move into this zone has a higher chance of facing rejection.
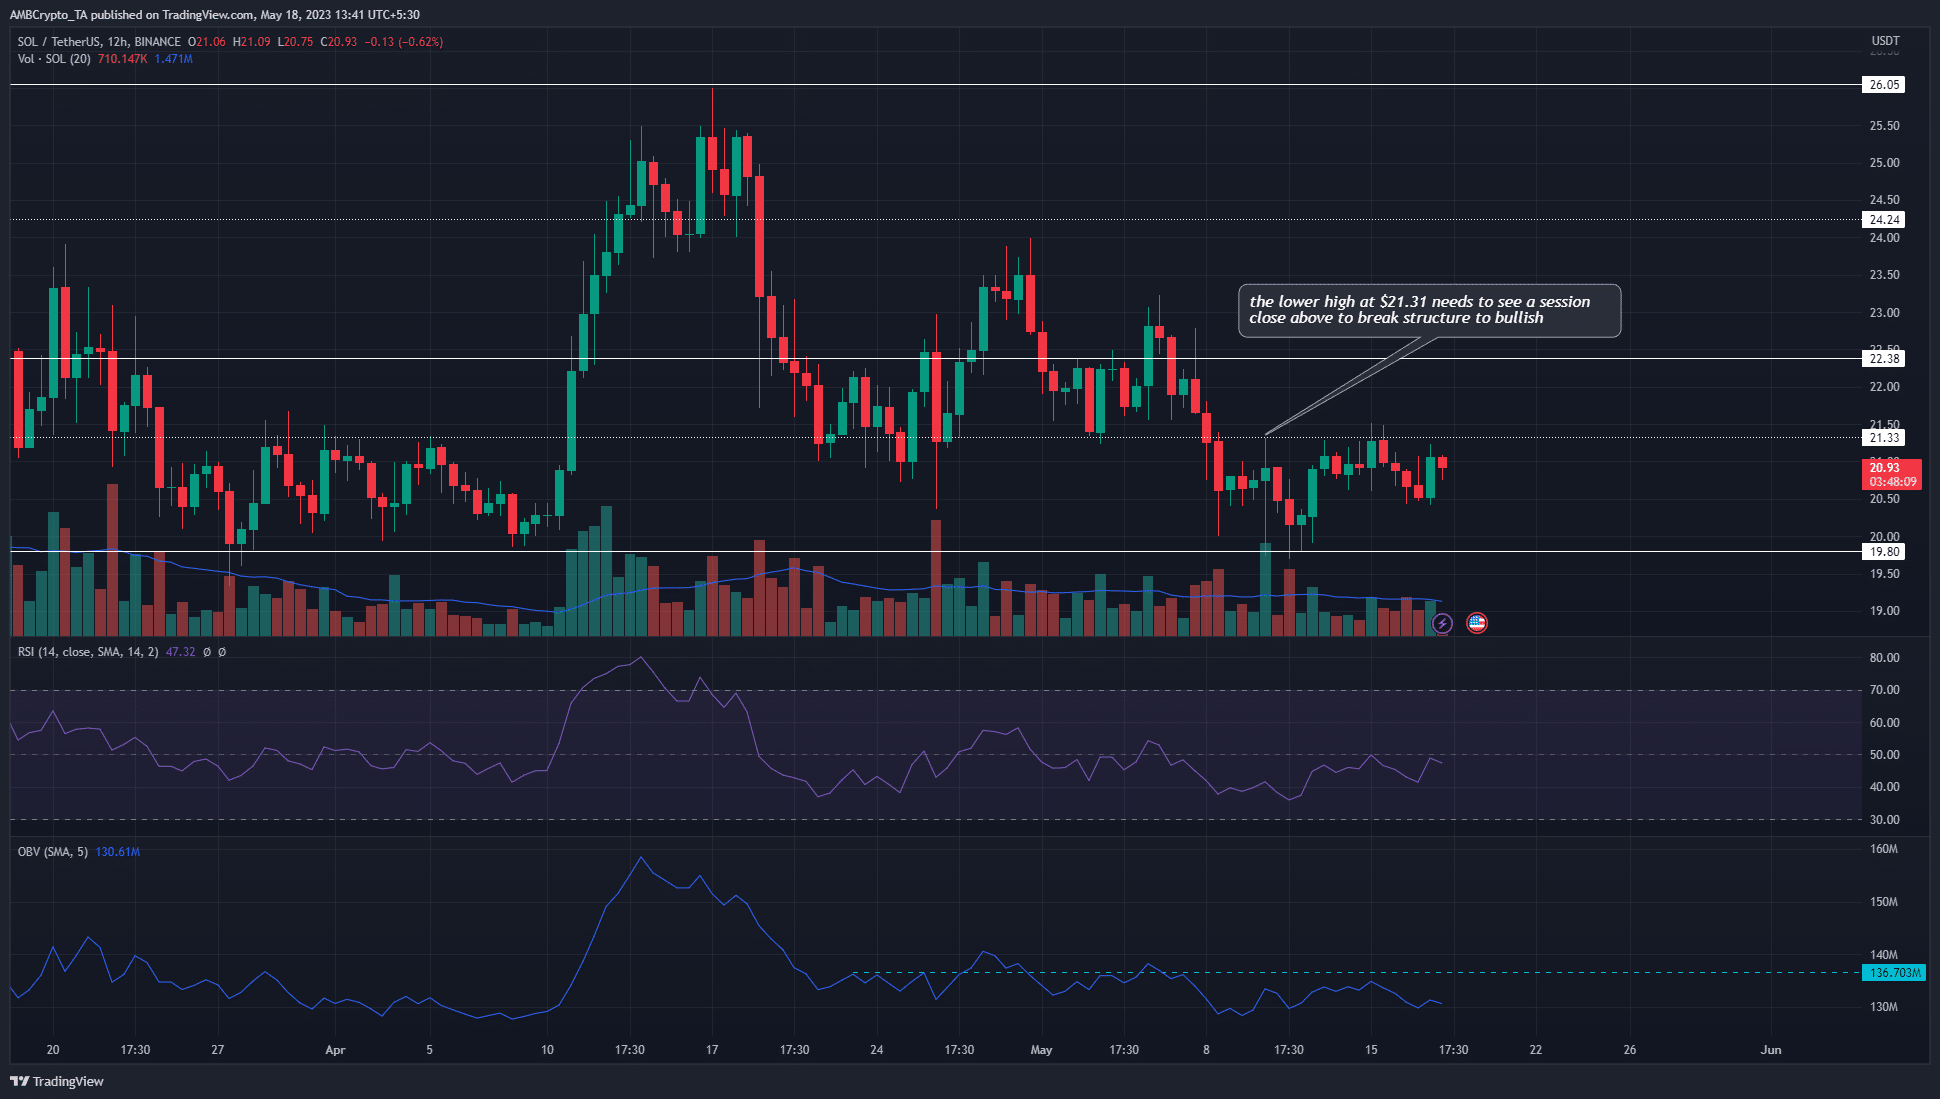
Meanwhile, the $21.33 level also offered stern resistance on the lower timeframes, but sentiment favored the buyers in the short-term.
$21.3 was tested as resistance but the buyers did not display strength
The 12-hour chart showed the market structure was bearish.
On 19 April SOL slipped $23.74, which was the higher low formed in mid-April. Thereafter Solana formed a series of lower highs, reinforcing the idea of a bearish market.
The RSI also fell below neutral 50 and has not crossed 55 since then.
This showed bearish momentum was still in power. Yet, over the past week,
Go to Source to See Full Article
Author: Akashnath S
Tip BTC Newswire with Cryptocurrency
Donate Bitcoin to BTC Newswire

Donate Bitcoin Cash to BTC Newswire

Donate Ethereum to BTC Newswire

Donate Litecoin to BTC Newswire

Donate Monero to BTC Newswire

Donate ZCash to BTC Newswire


