Disclaimer: The information presented does not constitute financial, investment, trading, or other types of advice and is solely the writer’s opinion.
- Solana witnessed a bullish structure on the D1 chart.
- The decline in the volume indicators suggested bullish traders can exercise some caution.
Solana [SOL] saw a decline in certain aspects such as user activity and non-vote transactions on the network. While this decline occurred in Q3, the price of the token appreciated considerably, going from $18 to $32 before retracing a good chunk of those gains.
How much are 1, 10, or 100 SOL worth today?
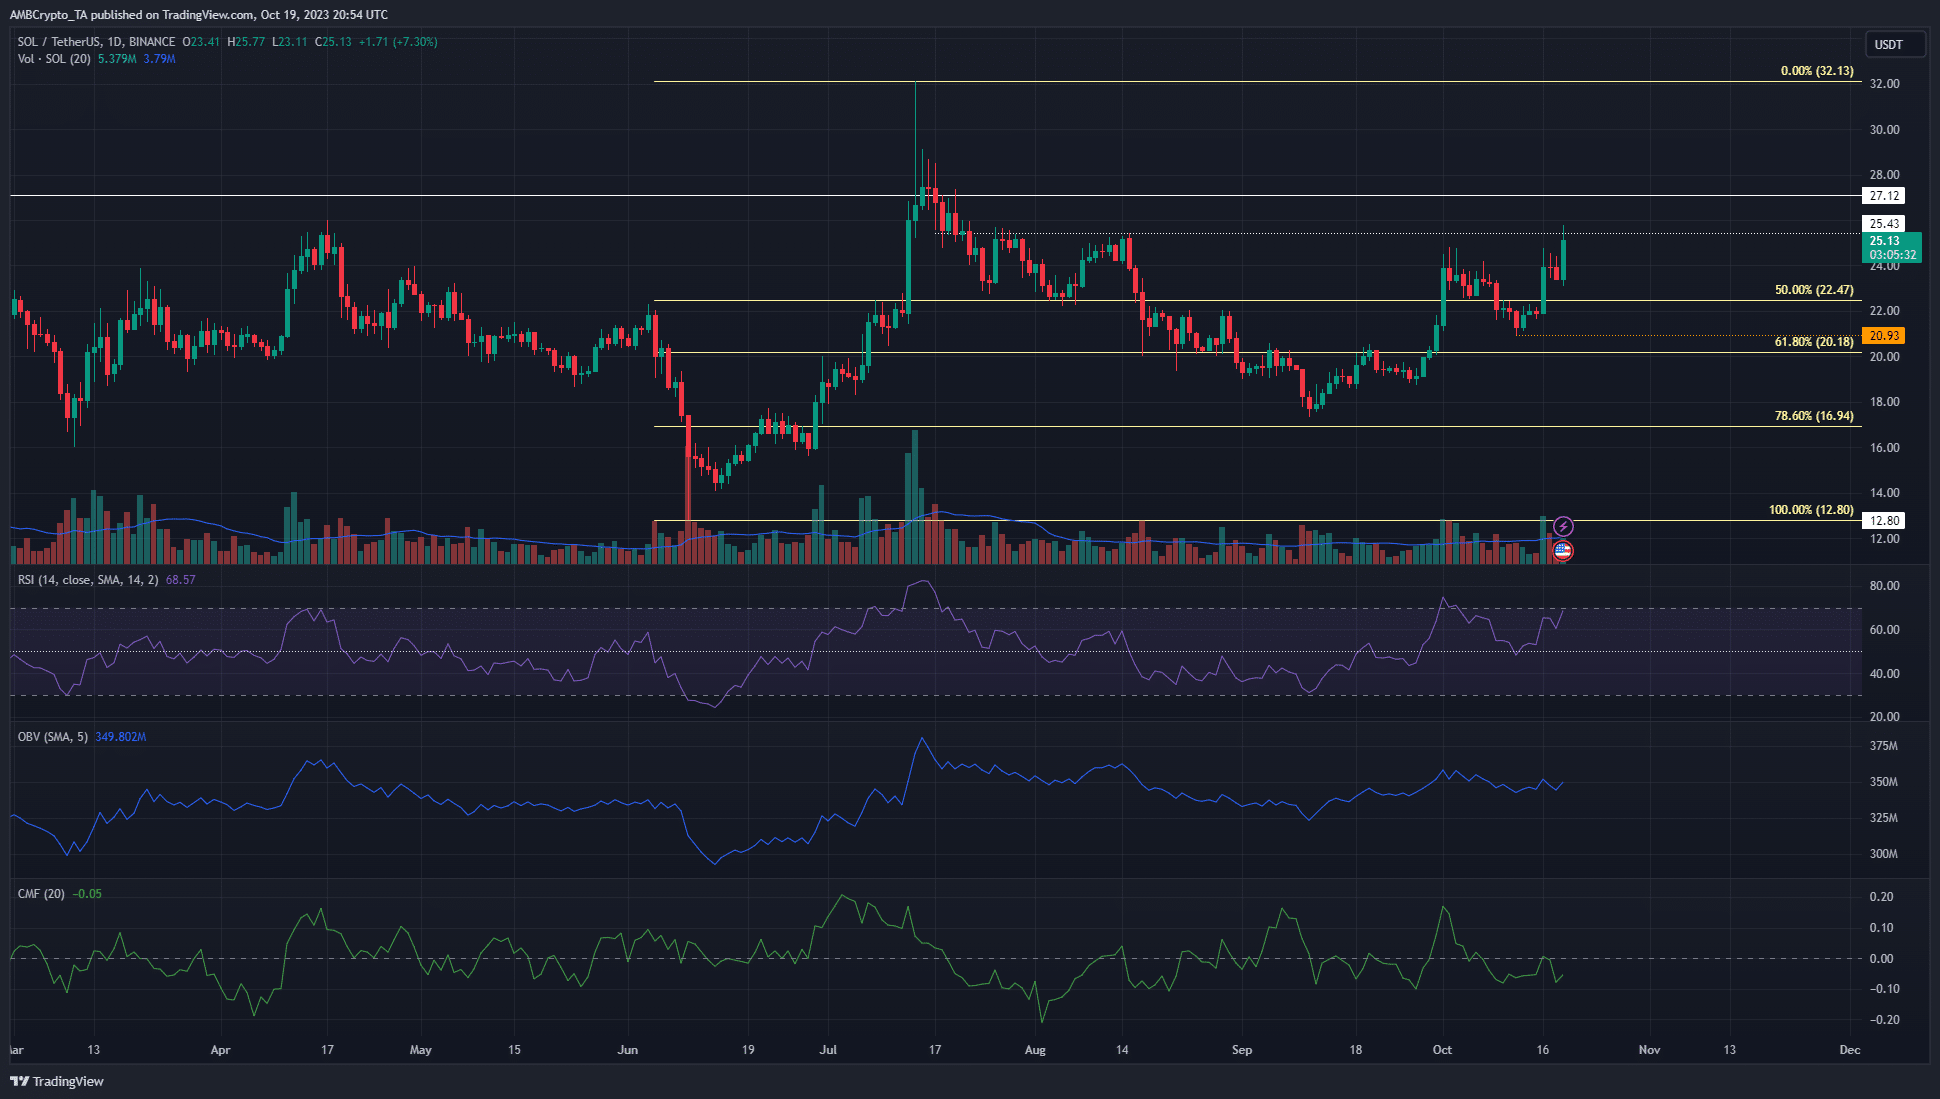
AMBCrypto noted that SOL was trading at a significant resistance zone at $25, and a flip of this zone to support could see the bulls drive prices to $27. Will SOL traders be forced to endure a period of consolidation, or can prices pump past the resistance quickly?
Solana’s market structure was firmly bullish
The one-day chart reflected the bullish leaning of market participants. The recent higher low was at $20.93 and a move below this would be necessary to shift the structure. Meanwhile, the Fibonacci retracement levels showed that the 78.6% level was nearly tested in mid-September before SOL embarked on its rally to $25.
Together they showed that a continuation of the uptrend was likely. Yet, the volume indicators were in disagreement. The On-Balance Volume (OBV) slowly trended downward since mid-July. It saw a brief uptick in the second half of September but began to descend in October. The Chaikin Money Flow (CMF) was at -0.05 at the time of writing.
Both indicators showed relatively strong selling pressure over the past ten days to two weeks. This was at odds with the price action and the
Go to Source to See Full Article
Author: Akashnath S
Tip BTC Newswire with Cryptocurrency
Donate Bitcoin to BTC Newswire

Donate Bitcoin Cash to BTC Newswire

Donate Ethereum to BTC Newswire

Donate Litecoin to BTC Newswire

Donate Monero to BTC Newswire

Donate ZCash to BTC Newswire


