
The Shiba Inu (SHIB) price created a bullish candlestick on January 8, saving a breakdown from a minor horizontal support area.
Is the bounce a sign of things to come, or will the SHIB price eventually break down?
Shiba Inu Bounces at Previous Resistance
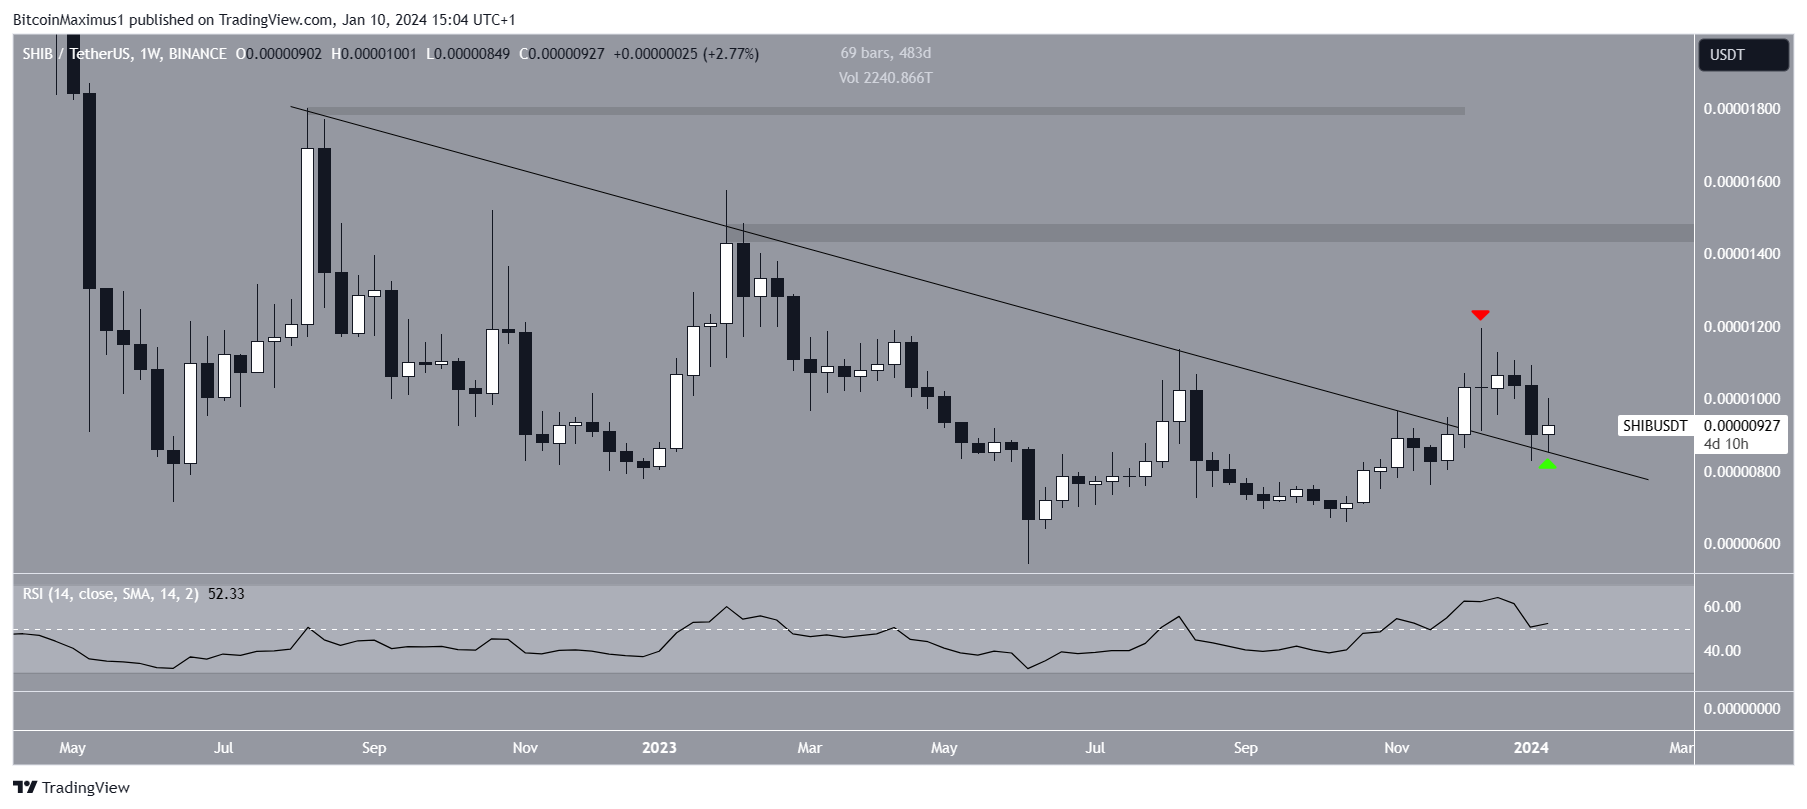
The technical analysis from the weekly time frame shows that the SHIB price had fallen under a descending resistance trend line since August 2022. The decrease led to a low of $0.0000054 in June 2023. The price has increased since.
After several unsuccessful breakout attempts, SHIB finally moved above the descending resistance trend line in December. At the time, the trend line had existed for a little more than 480 days.
While the price reached a high of $0.000011 after the breakout, it has fallen since (red icon). Last week, SHIB validated the trend line as support (green icon) before bouncing.
When evaluating market conditions, t
Go to Source to See Full Article
Author: Valdrin Tahiri
Tip BTC Newswire with Cryptocurrency
Donate Bitcoin to BTC Newswire

Donate Bitcoin Cash to BTC Newswire

Donate Ethereum to BTC Newswire

Donate Litecoin to BTC Newswire

Donate Monero to BTC Newswire

Donate ZCash to BTC Newswire


