
Shiba Inu’s (SHIB) price broke out from a short-term descending resistance trend line but did not sustain its upward movement.
SHIB trades under a longer-term descending resistance trend line and in the lower portion of a corrective pattern.
SHIB Falls Under Long-Term Resistance
The weekly time frame technical analysis shows the SHIB price has fallen under a descending resistance trend line since August 2022. The resistance trend line has caused numerous rejections, the most recent in December 2023 (red icon). This trend line has existed for 560 days.
During this time, the SHIB price broke down from a horizontal support area. However, it reclaimed it shortly afterward instead of accelerating the downward movement. Despite reclaiming the area, SHIB did not break out from the descending resistance trend line.
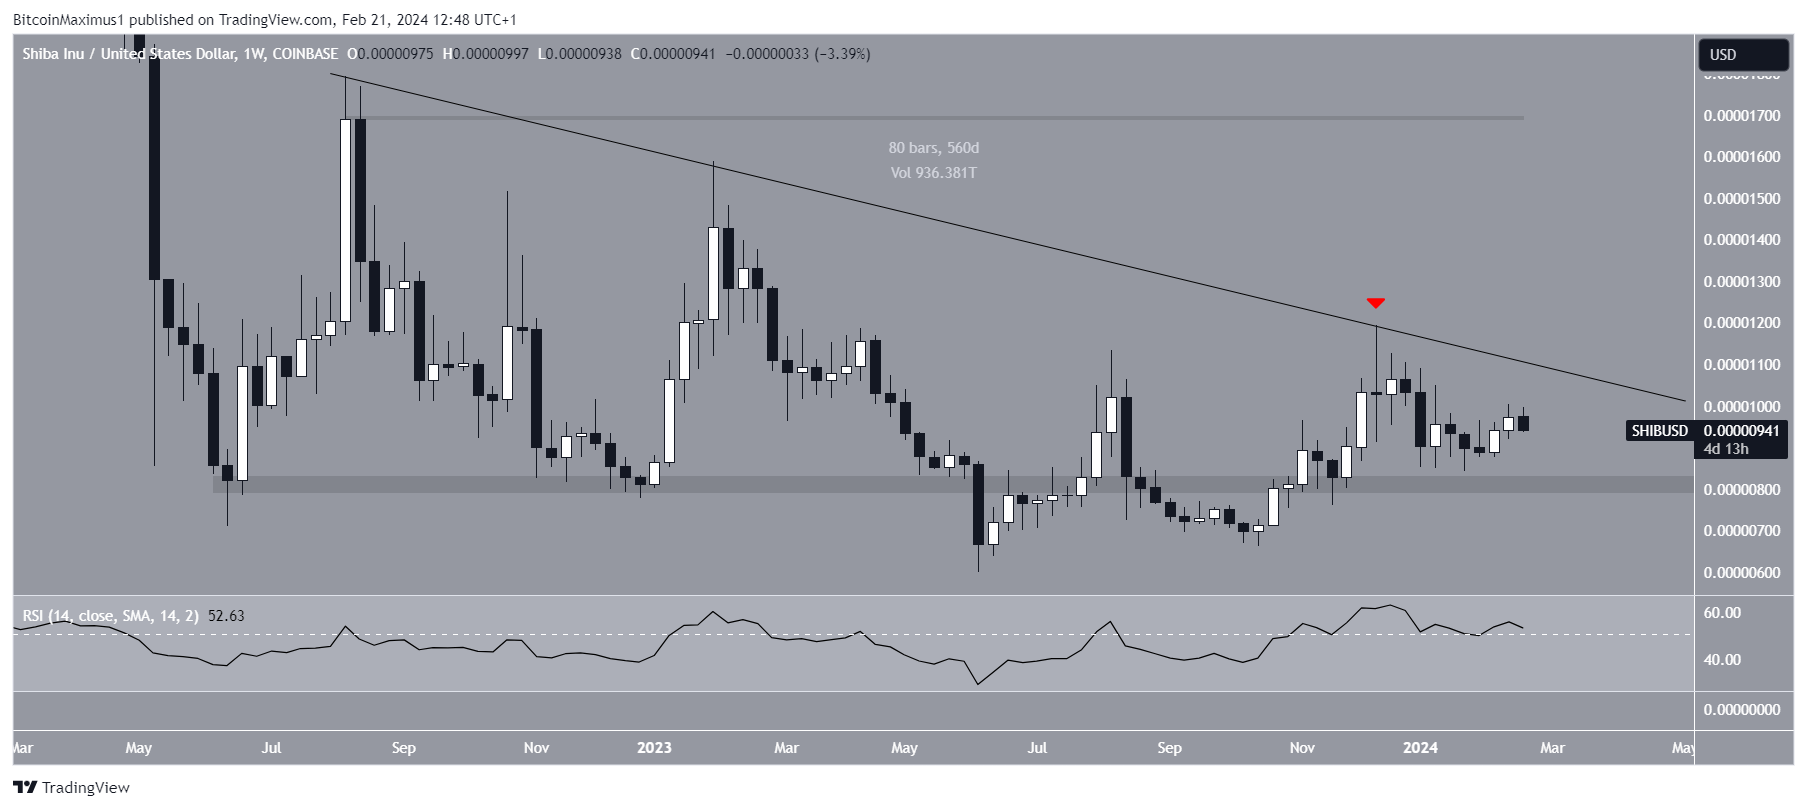
Furthermore, the weekly Relative Strength Index (RSI) does not confirm the trend’s direction. When ev
Go to Source to See Full Article
Author: Valdrin Tahiri
Tip BTC Newswire with Cryptocurrency
Donate Bitcoin to BTC Newswire

Donate Bitcoin Cash to BTC Newswire

Donate Ethereum to BTC Newswire

Donate Litecoin to BTC Newswire

Donate Monero to BTC Newswire

Donate ZCash to BTC Newswire


