
The Shiba Inu (SHIB) price trades below long- and short-term diagonal resistance levels. It recently validated a confluence of resistances, increasing its legitimacy.
Both short- and long-term time frame readings support the continuing decrease. Thus, the meme coin is likely mired in a bearish trend.
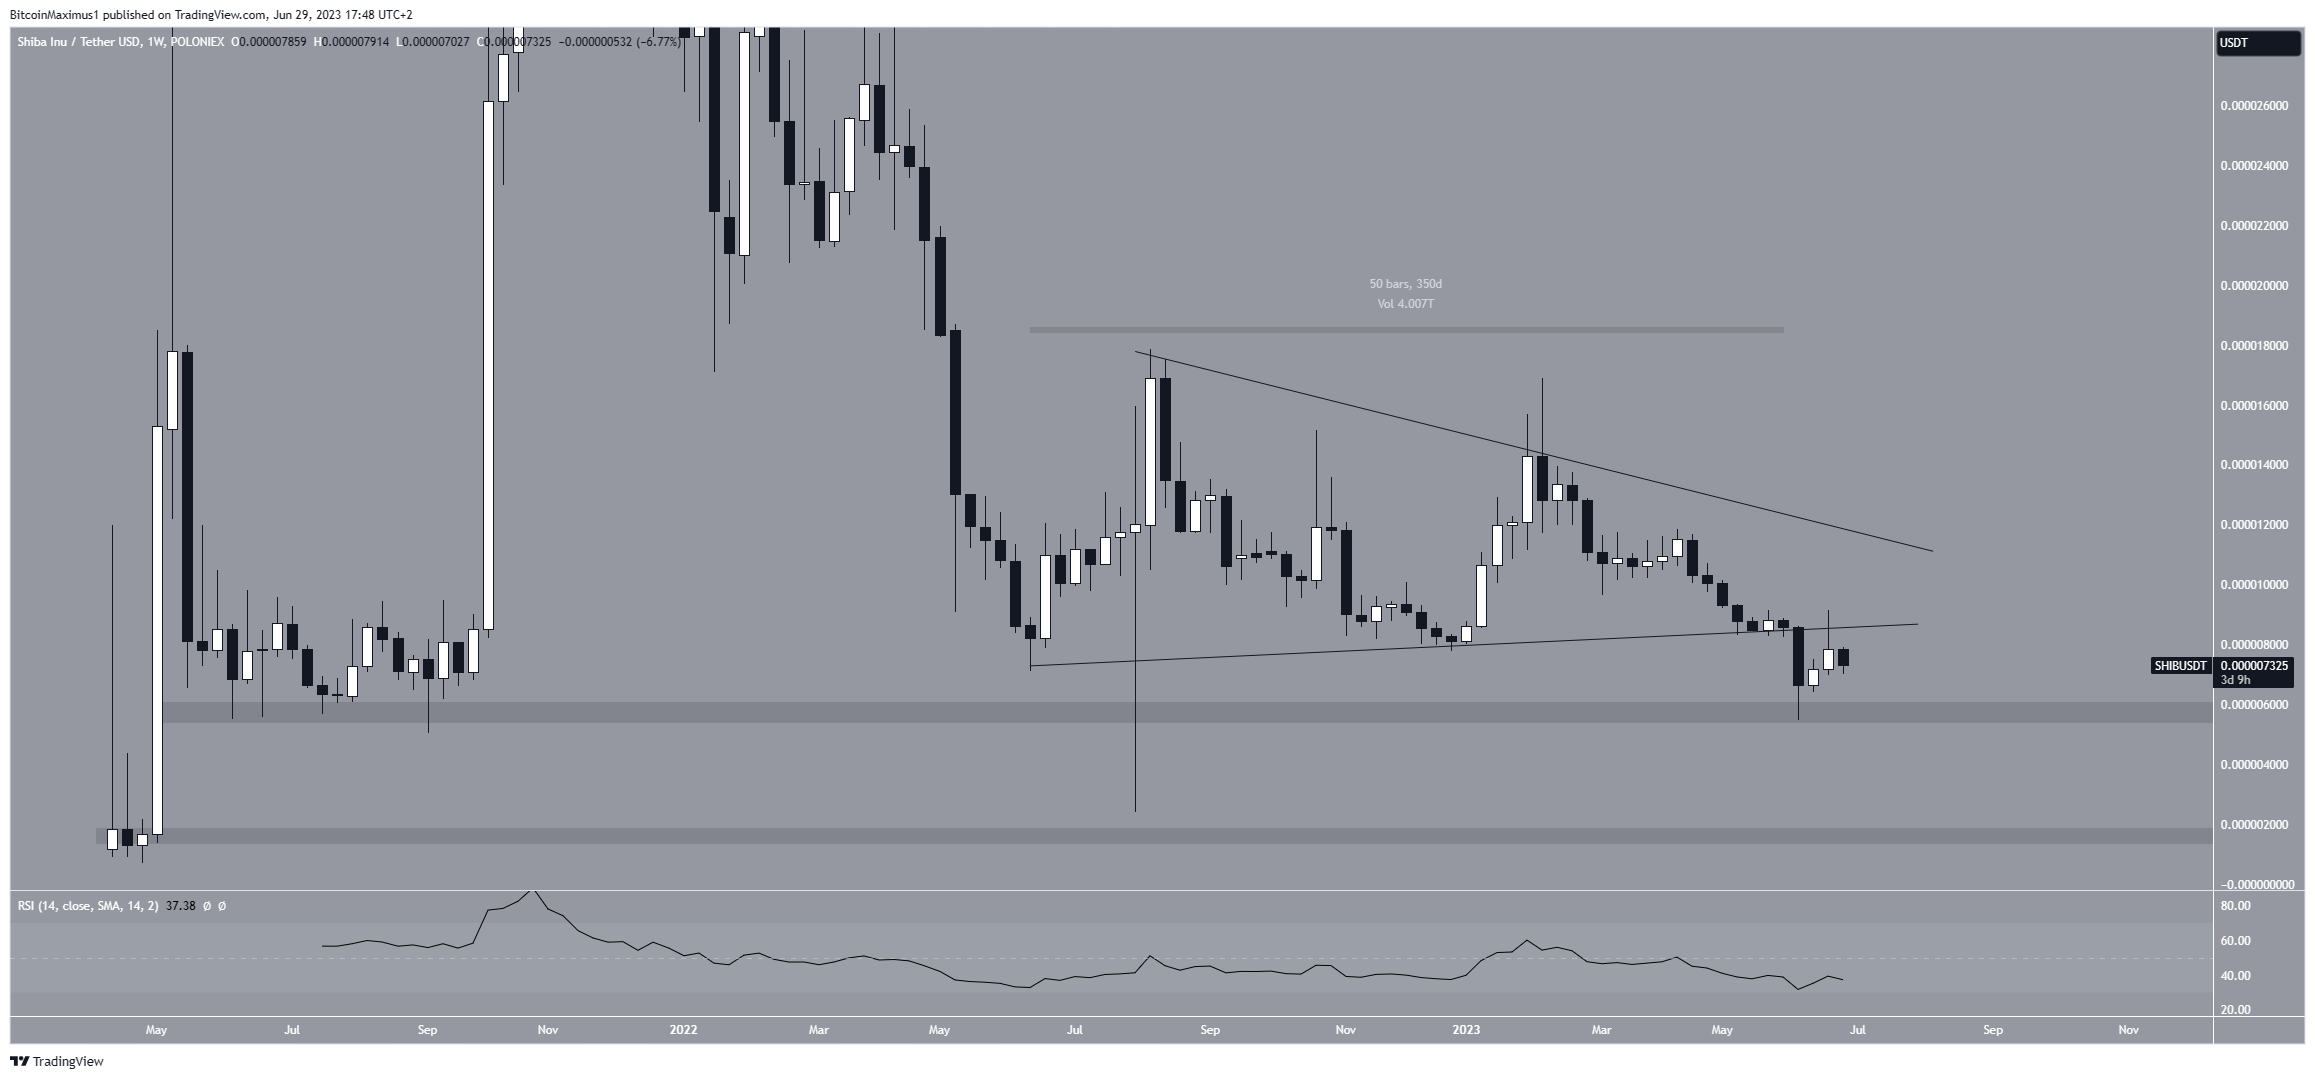
Shiba Inu Price Breaks Down and Validates 350-Day Pattern as Resistance
The technical analysis conducted on a weekly time frame suggests a decisively bearish outlook for the Shiba Inu price. This assessment is primarily based on the breakdown of a symmetrical triangle pattern that has been present since June 2022.
When the pattern was breached, the price had traded inside it for a duration of 350 days. Breakdowns from such long-term patterns usually lead to sustained downward movements.
Following the breakdown, the SHIB price reached a horizontal support level at $0.0000058 and experienced a rebound. This support level has not been observed since the end of 2021.
While the level successfully initiated a bounce, the triangle’s support line rejected the SHIB price (red icon). Therefore, it is likely that the trend is still bearish.
Go to Source to See Full Article
Author: Valdrin Tahiri
Tip BTC Newswire with Cryptocurrency
Donate Bitcoin to BTC Newswire

Donate Bitcoin Cash to BTC Newswire

Donate Ethereum to BTC Newswire

Donate Litecoin to BTC Newswire

Donate Monero to BTC Newswire

Donate ZCash to BTC Newswire


