
The long-term pattern for the Shiba Inu (SHIB) price remains intact, but its short-term pattern is at risk of breaking down.
Currently, the SHIB price is attempting to bounce at the support line of its short-term pattern. It remains to be seen if the price can hold there or if the downward movement will escalate further.
Shiba Inu Gradually Moves Toward Support
The daily time frame indicates that the SHIB price has been trading inside a symmetrical triangle since June 2022. This type of pattern is neutral, implying that both a breakout and a breakdown are possible. The price is currently trading in the middle of the triangle, experiencing a downward trend since the resistance line rejection on February 4th (marked in red).
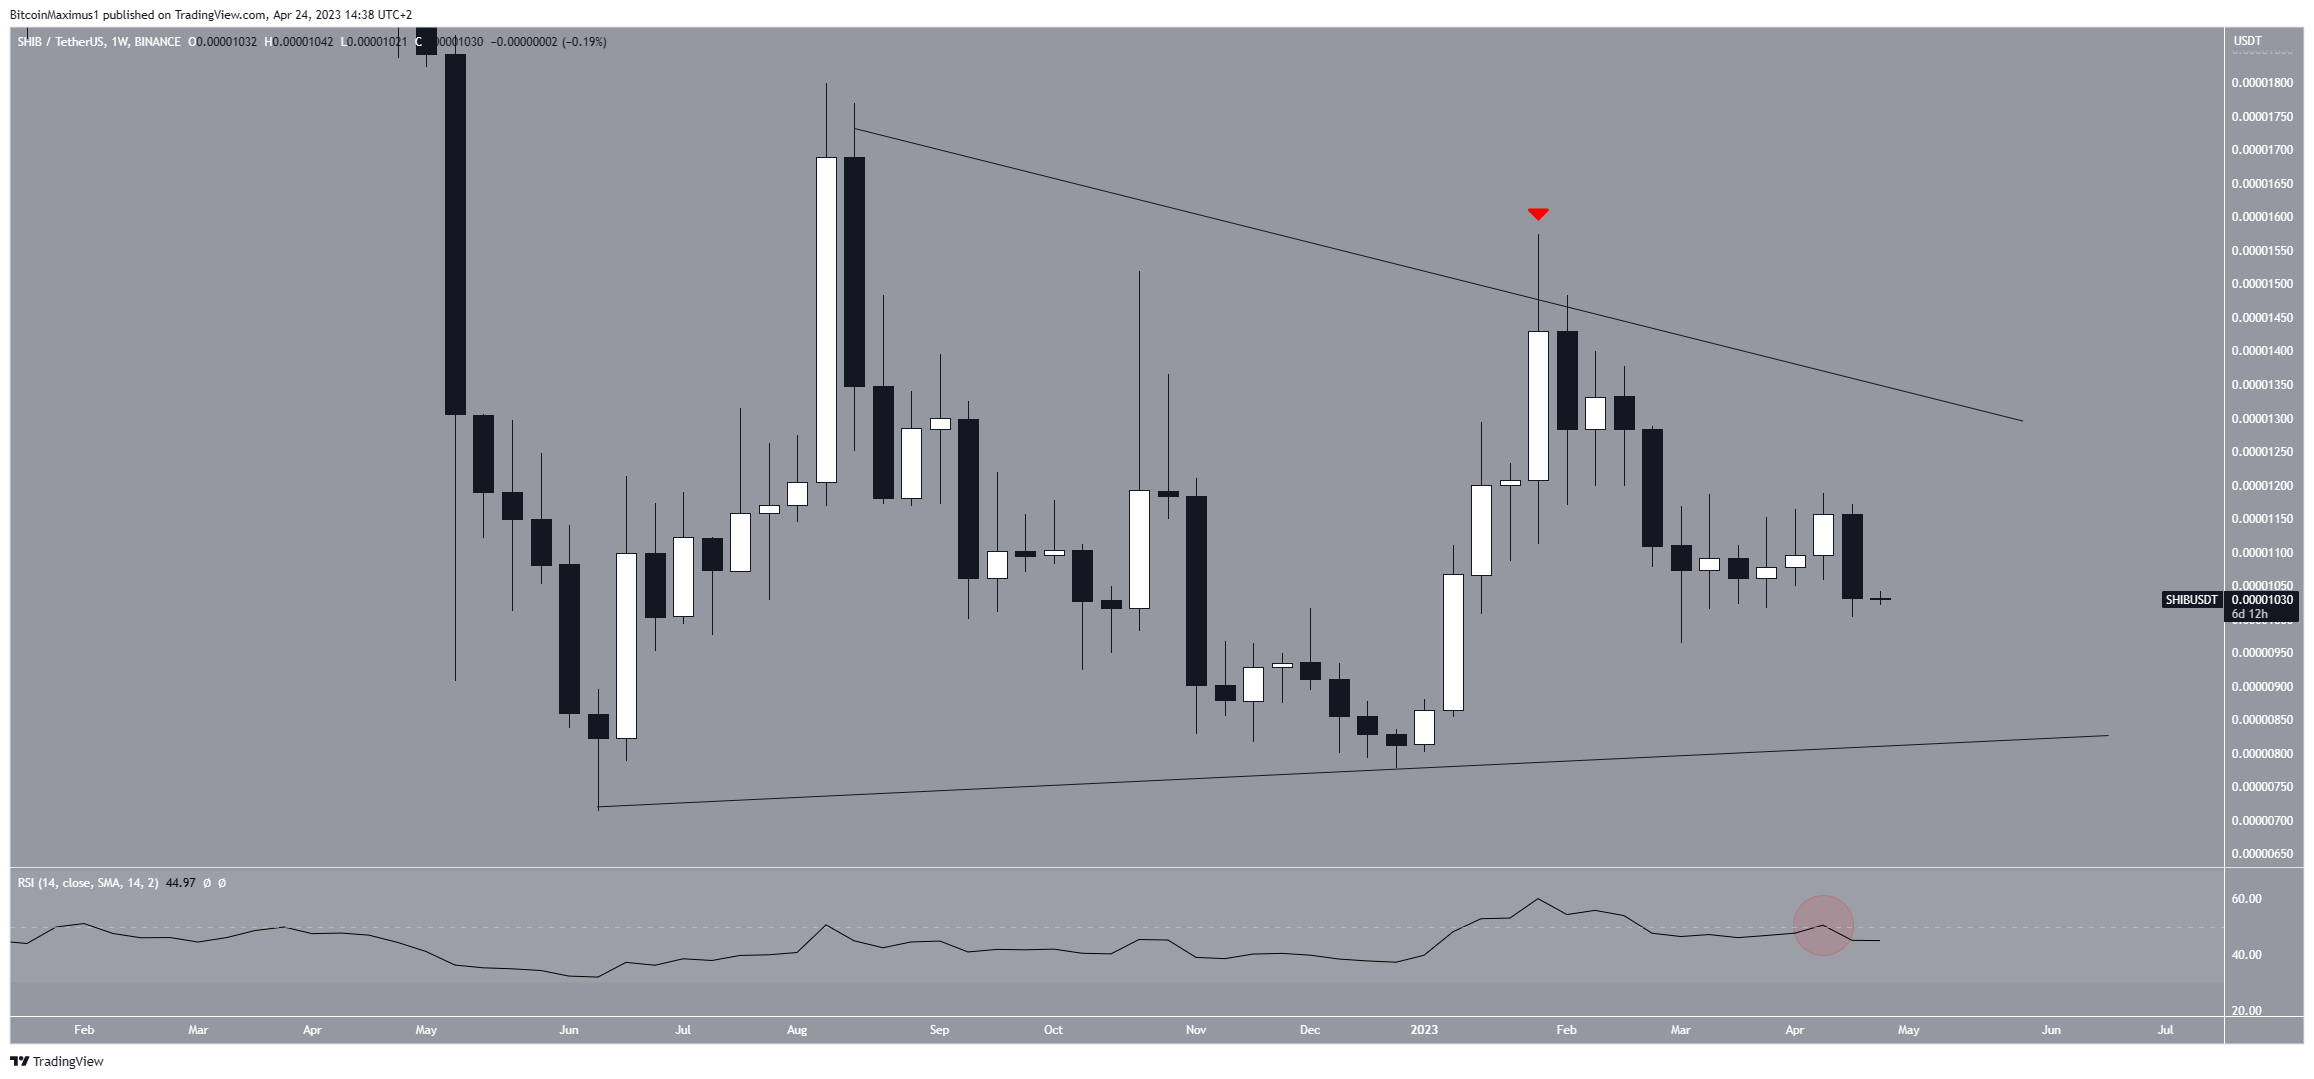
The daily Relative Strength Index (RSI) reading also supports the continuation of the drop. Traders utilize the RSI as a momentum indicator to assess whether a market is overbought or oversold and to determine whether to accumulate or sell an asset.
If the RSI reading is above 50 and the trend is upward, bulls still have an advantage, but if the reading is below 50, the opposite
Go to Source to See Full Article
Author: Valdrin Tahiri
Tip BTC Newswire with Cryptocurrency
Donate Bitcoin to BTC Newswire

Donate Bitcoin Cash to BTC Newswire

Donate Ethereum to BTC Newswire

Donate Litecoin to BTC Newswire

Donate Monero to BTC Newswire

Donate ZCash to BTC Newswire


