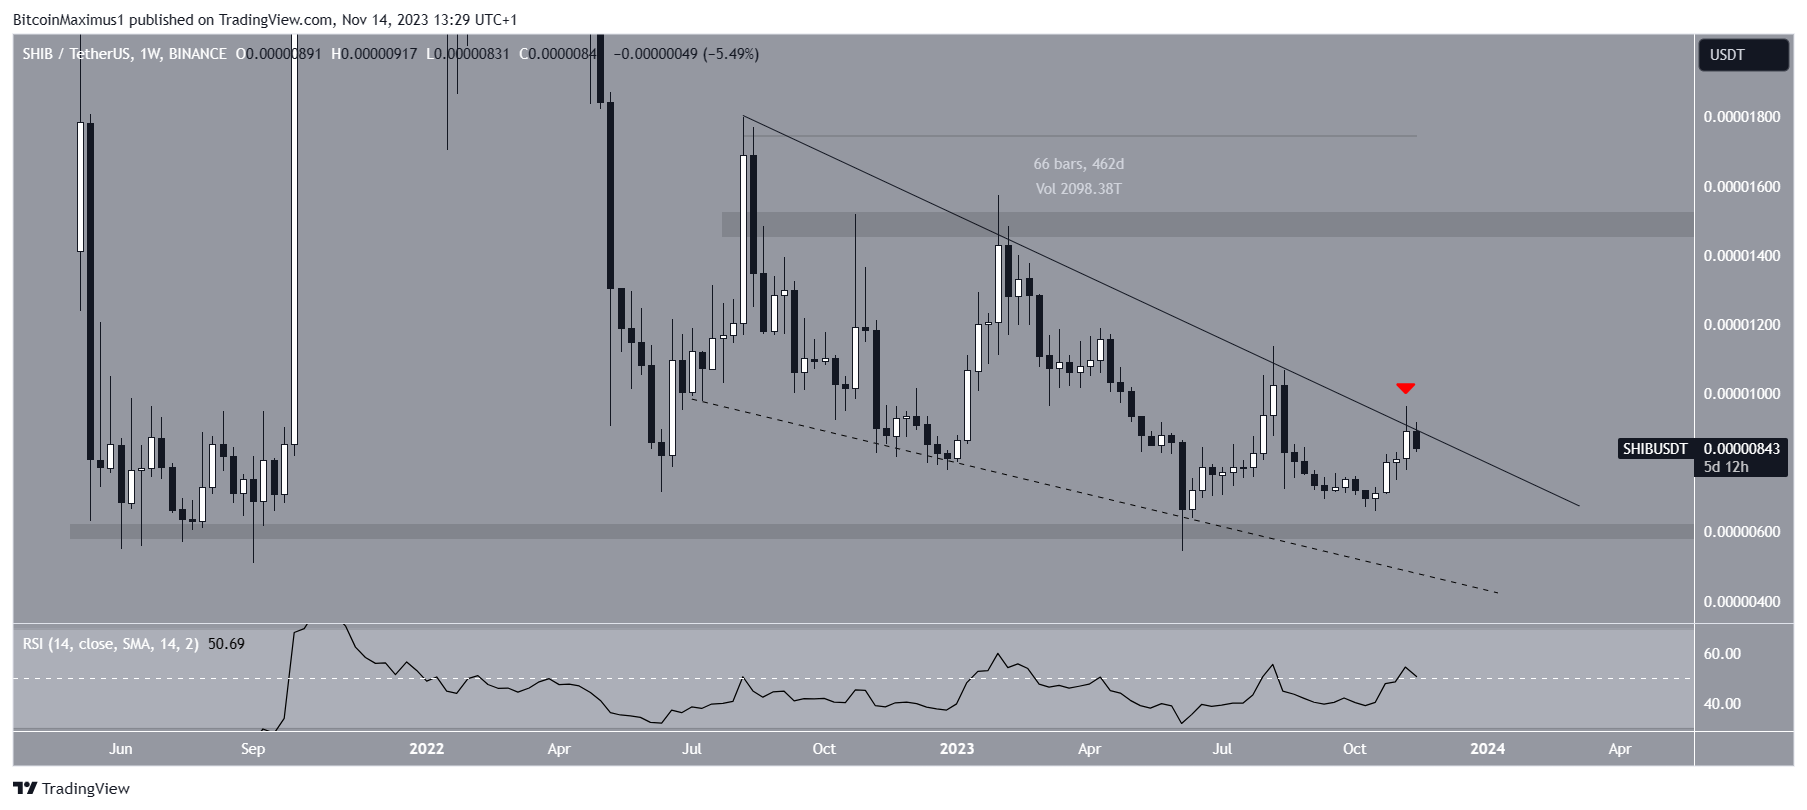
The Shiba Inu (SHIB) price has fallen since a confluence of resistance levels rejected it on November 12.
The price now trades at a critical horizontal support area. Will it bounce or break down?
Shiba Inu Does Not Break Out
The technical analysis from the weekly timeframe shows that the SHIB price has fallen under a descending resistance trend line since August 2022. So far, the trend line has been in place for 470 days.
Shiba Inu was rejected by the trend line last week and the one before (red icons), initiating the ongoing downward movement. These were the third and fourth rejections from this trend line.
While the SHIB price may be trading inside a descending wedge, its support line (dashed) has yet to be validated sufficient times.
Read more: Shiba Inu (SHIB) Price Predictions
When evaluating market conditions, traders use the RSI as a momentum indicator to determine whether a market is overbought or oversold and whether to accumulate or sell an asset.
If the RSI reading is above 50 and the trend is upward, bulls still have an advantage, but if the reading is below 50, the opposite is true.
The weekly RSI is right at 50, indicating an undetermined trend.

Go to Source to See Full Article
Author: Valdrin Tahiri


