Disclaimer: The information presented does not constitute financial, investment, trading, or other types of advice and is solely the writer’s opinion.
- XRP remained confined in a compact range.
- Tight margins between buyers and sellers in the futures market.
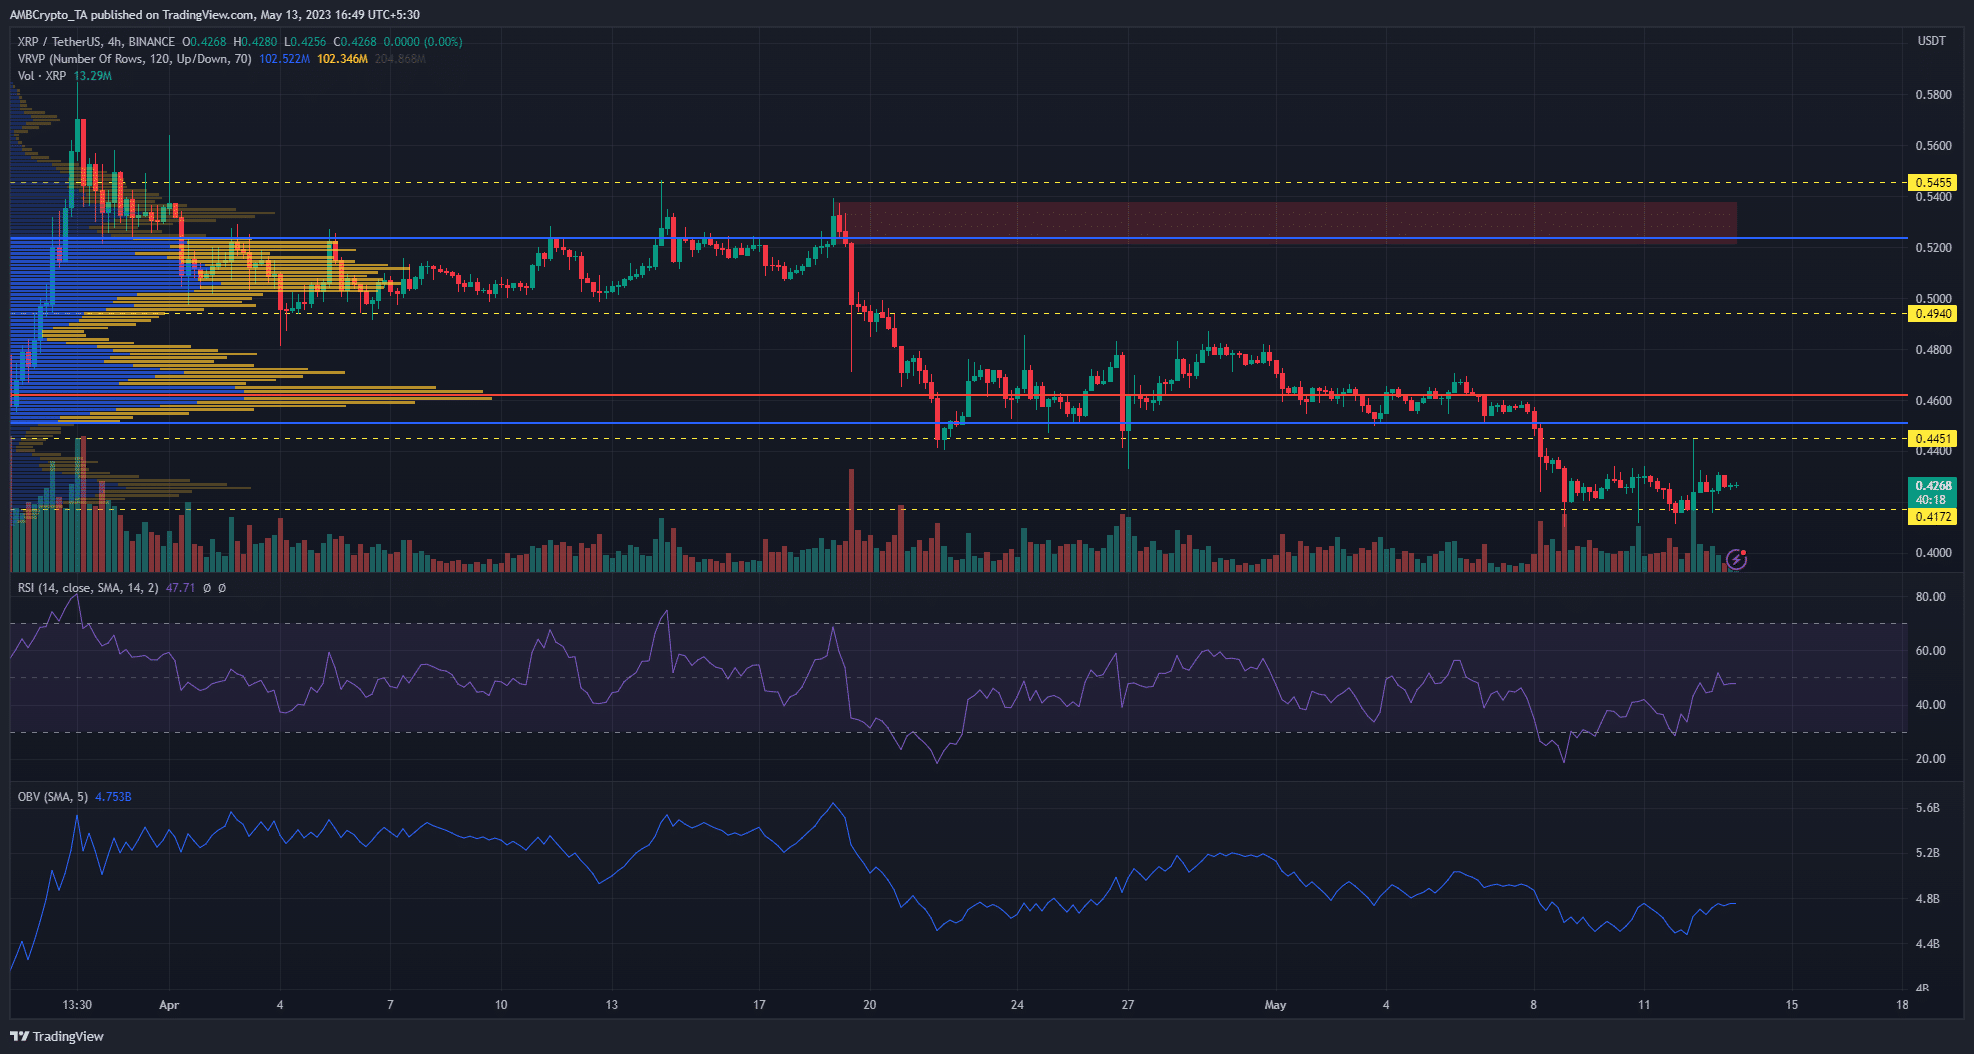
Ripple [XRP] has been on a downward trend since 19 April, after it failed to break the $0.5400 resistance level. Its recent price action has confined it to a tight range, oscillating between the $0.4172 support and $0.4551 resistance.
Realistic or not, here’s XRP’s market cap in BTC’s terms
With Bitcoin [BTC] posting gains of 1.6% within the past 24 hours, a breakout could occur for XRP.
Bulls or bears – who will prevail?
XRP buyers and sellers have been locked in a fierce battle for control. Following the price rejection at the $0.5400 level, the price found support at the $0.4551 level. Prices ranged between $0.4900 and $0.4551 before further selling pressure pushed XRP lower.
With its price oscillating between $0.4172 and $0.4551 at press time, on-chart indicators could provide some insight into XRP’s next move.
On the four-hour chart, the Visible Range Volume Profile showed that the Value Area High (VAH) and Value Area Low (VAL) sat at $0.5240 and $0.4514, respectively. The Point of Control (POC) at $0.4627 lay very close to the VAL. This signaled that the price action in the range between the POC and VAL could heavily influence XRP’s next move.
The Relative Strength Indicator (RSI) and On Balance Volume (OBV) both flashed neutral signals. The RSI rallied briefly from the oversold zone but failed to breach the neutral 50 mark. The OBV also moved sideways in the same period–a sign of wavering demand.
A four-hour candle close above the $0.4551 resistance and VAL could spur a bullish rally with
Go to Source to See Full Article
Author: Suzuki Shillsalot
Tip BTC Newswire with Cryptocurrency
Donate Bitcoin to BTC Newswire

Donate Bitcoin Cash to BTC Newswire

Donate Ethereum to BTC Newswire

Donate Litecoin to BTC Newswire

Donate Monero to BTC Newswire

Donate ZCash to BTC Newswire


