- QNT faced critical resistance levels; key support at $89 could determine its next move.
- Declining address activity and rising NVT ratio suggested potential market correction ahead.
Quant [QNT] has been showing bullish sentiment, fueled by strong support from both retail and smart money investors.
However, despite this positive outlook, key resistance levels and a decline in address activity suggest the token may face some challenges. At press time, QNT was trading at $89.21, marking a 1.33% decline over the past 24 hours.
As the market continues to evaluate QNT’s future, there are growing concerns about whether the token can maintain its current momentum.
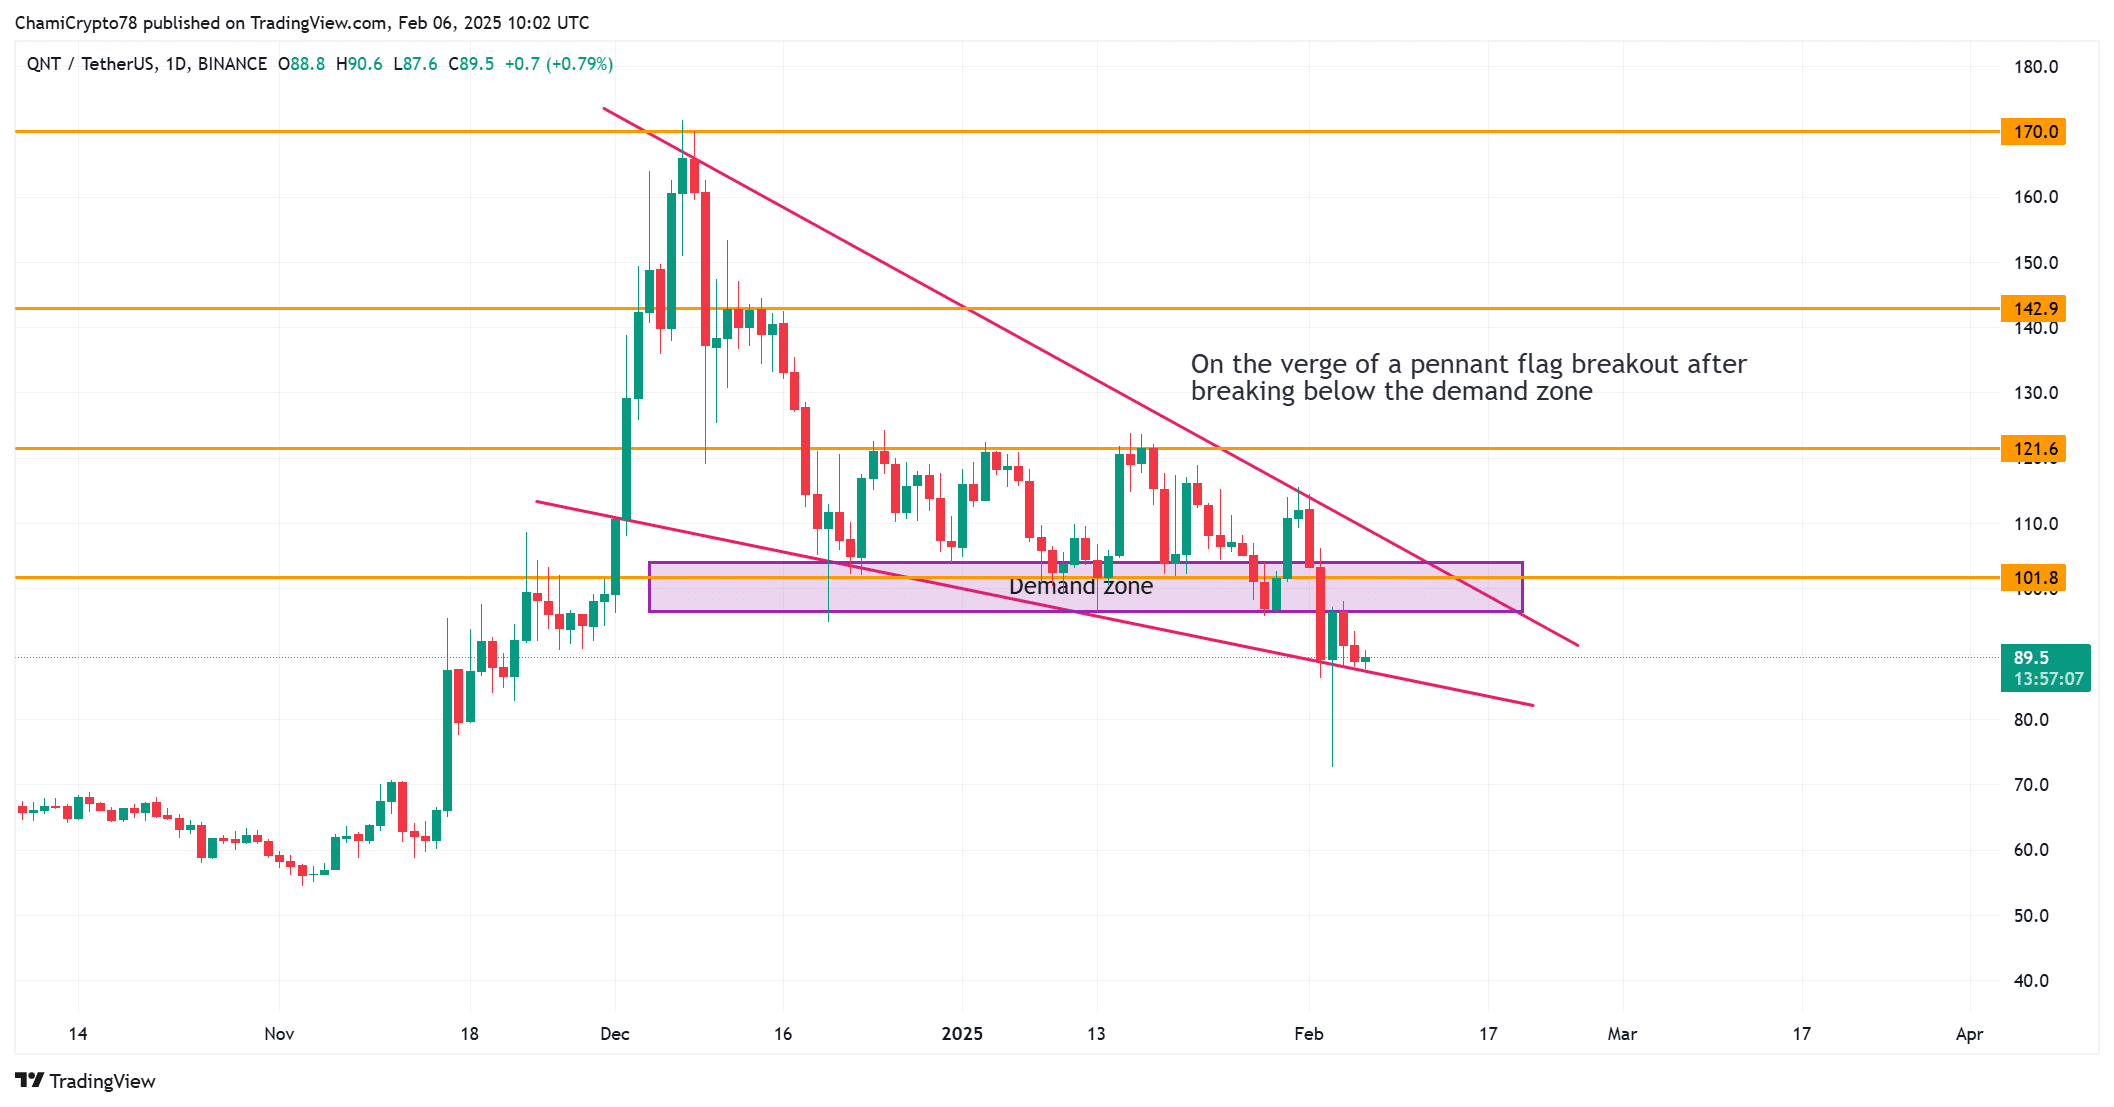
Quant chart outlook: A critical crossroads
Quant’s price chart reveals a significant technical pattern. The asset has recently broken below its demand zone and is now testing key support around $89. If this support level fails to hold, the price may drop toward $72.65.
However, if QNT rebounds from this zone, it could push toward $101.8, where it faces considerable resistance.
With a potential pennant flag breakdown in play, investors must remain vigilant about the possibility of a bearish trend if support levels are not maintained.
QNT In/Out of the Money: A sign of caution?
At press time, the “In/Out of the Money” chart indicates that 61.65% of QNT holders were profitable. However, 33.59% of addresses are “Out of the Money,” with significant resistance levels between $95.39 and $106.08.
This disparity highlights the challenges QNT faces in overcoming these price barriers.
If these resistance levels are not broken, the market could experience a reversal as holders look to lock in profits.