
Bitcoin extended its decline on May 12, but analyst Philip Swift, co-founder of trading suite Decentrader and creator of data resource LookIntoBitcoin, does not expect a deep correction. He said it was “interesting to note that the long/short ratio has been climbing as price has trended down.”
One of the reasons that is keeping analysts bullish is Bitcoin’s (BTC) halving, which has followed a set cycle until now, and analysts expect it to continue. Citing previous cycles, investor and entrepreneur Alistair Milne, said that the time to buy is now.
However, in the near term, Bitcoin could be facing pressure due to the relief rally in the U.S. dollar index (DXY). Typically, the DXY has an inverse correlation with Bitcoin’s performance.
What are the important support levels that may attract buyers in Bitcoin and the major altcoins? Let’s study the charts of the top 10 cryptocurrencies to find out.
Bitcoin price analysis
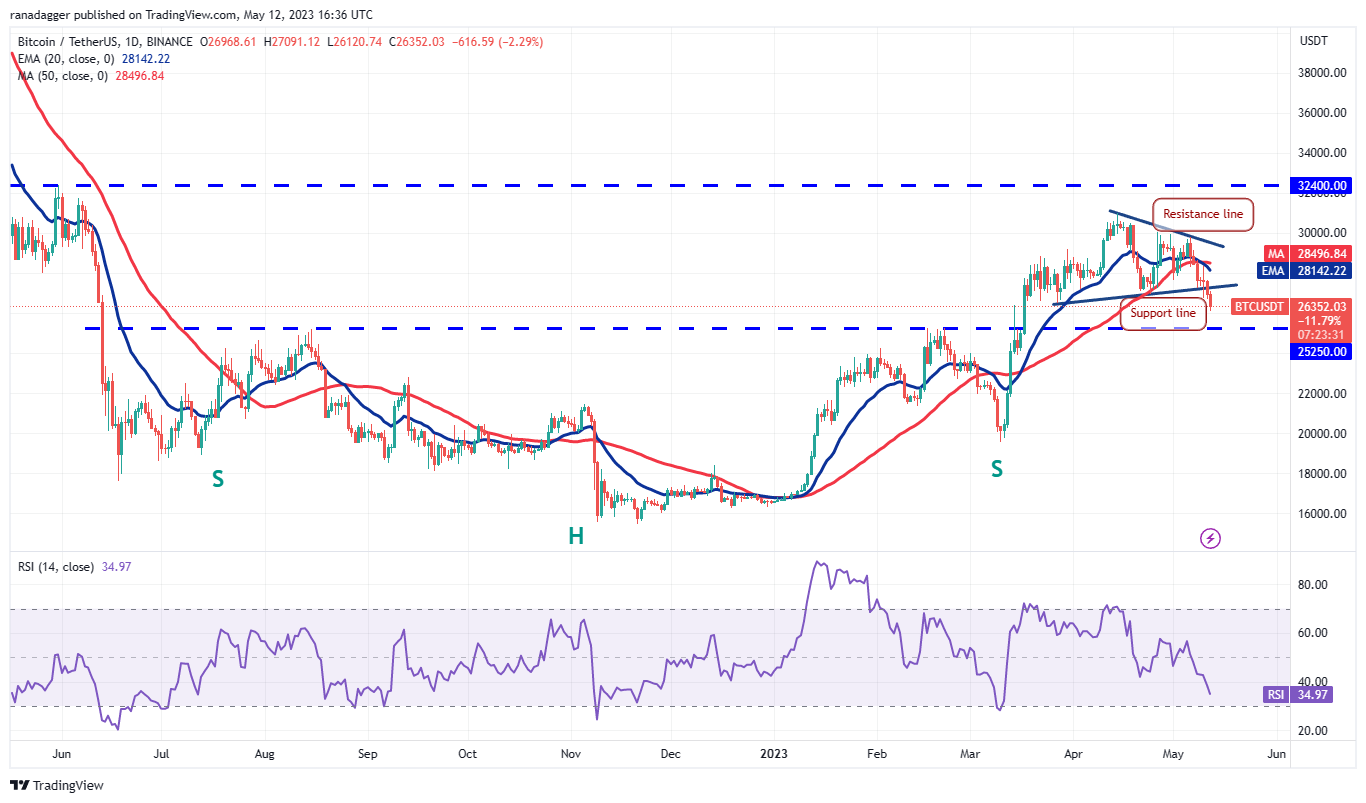
Bitcoin formed a long-legged doji candlestick pattern on May 10, indicating indecision among the bulls and the bears. The sellers resolved that to the downside with a break below the support line of the symmetrical triangle pattern.
Author: Rakesh Upadhyay
Tip BTC Newswire with Cryptocurrency
Donate Bitcoin to BTC Newswire

Donate Bitcoin Cash to BTC Newswire

Donate Ethereum to BTC Newswire

Donate Litecoin to BTC Newswire

Donate Monero to BTC Newswire

Donate ZCash to BTC Newswire
