
Bitcoin (BTC) has been holding its yearly gains but is finding it difficult to break above its 17-month highs of $44,700 set earlier this month. This suggests that market participants are not loading up aggressively prior to the decision on the spot Bitcoin exchange-traded fund (ETFs) applications, anticipated in January.
It is difficult to predict how traders will respond if one or more spot Bitcoin ETFs are approved. A lack of solid demand for the ETFs after approval could turn it into a “sell the news” event, while a strong inflow into the ETFs in the first few days could result in a spike in Bitcoin’s price.
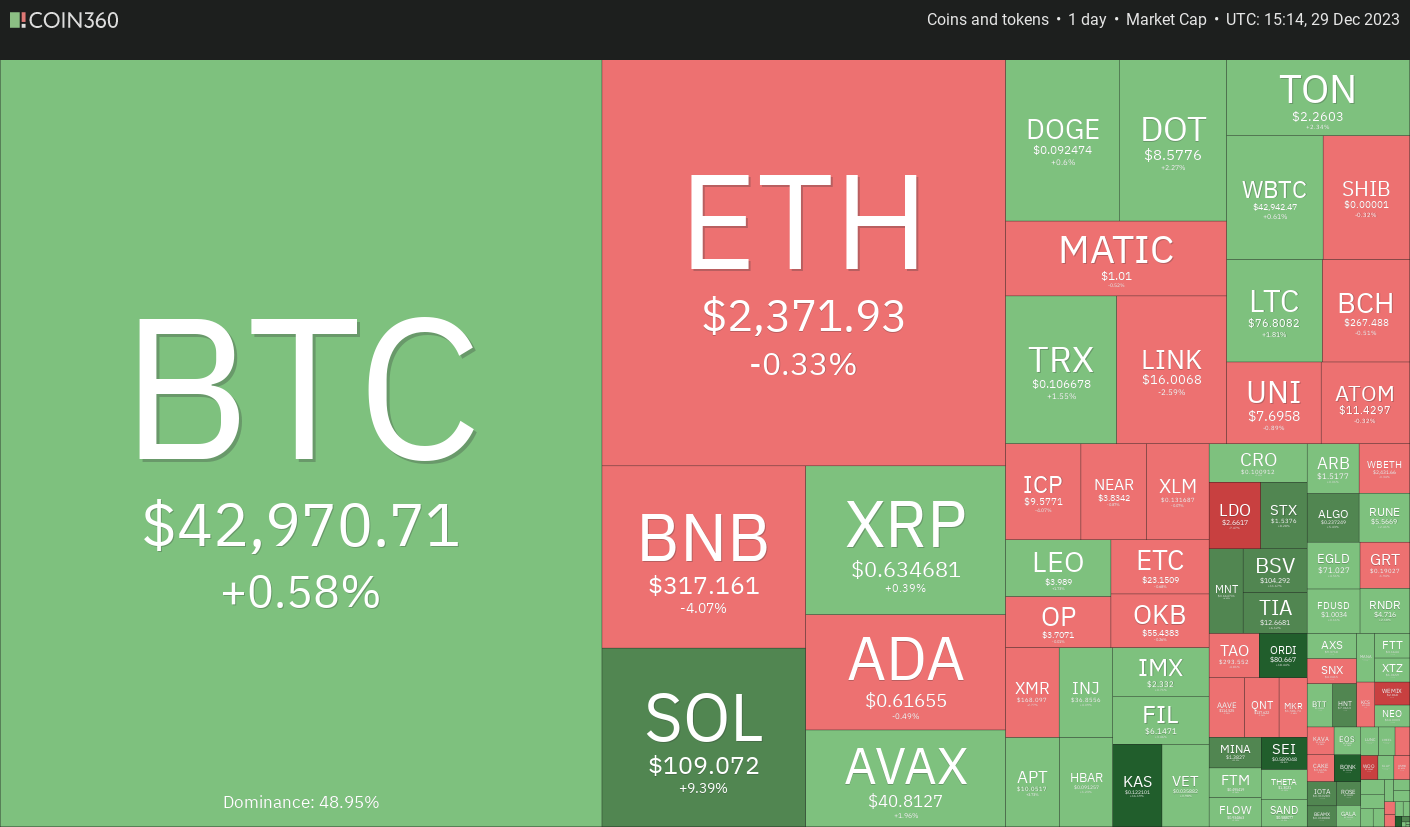
The uncertainty about Bitcoin’s short-term price action has boosted buying interest in altcoins. That is one of the reasons for the drop in Bitcoin’s dominance from about 55% to 51% in the past few days.
Will Bitcoin resume its uptrend or succumb to profit booking? Could altcoins continue their outperformance? Let’s analyze the charts of the top 10 cryptocurrencies to find out.
Bitcoin price analysis
Bitcoin fell below the 20-day exponential moving average (EMA) ($42,597) on Dec. 29 but continues to trade inside the ascending triangle pattern.
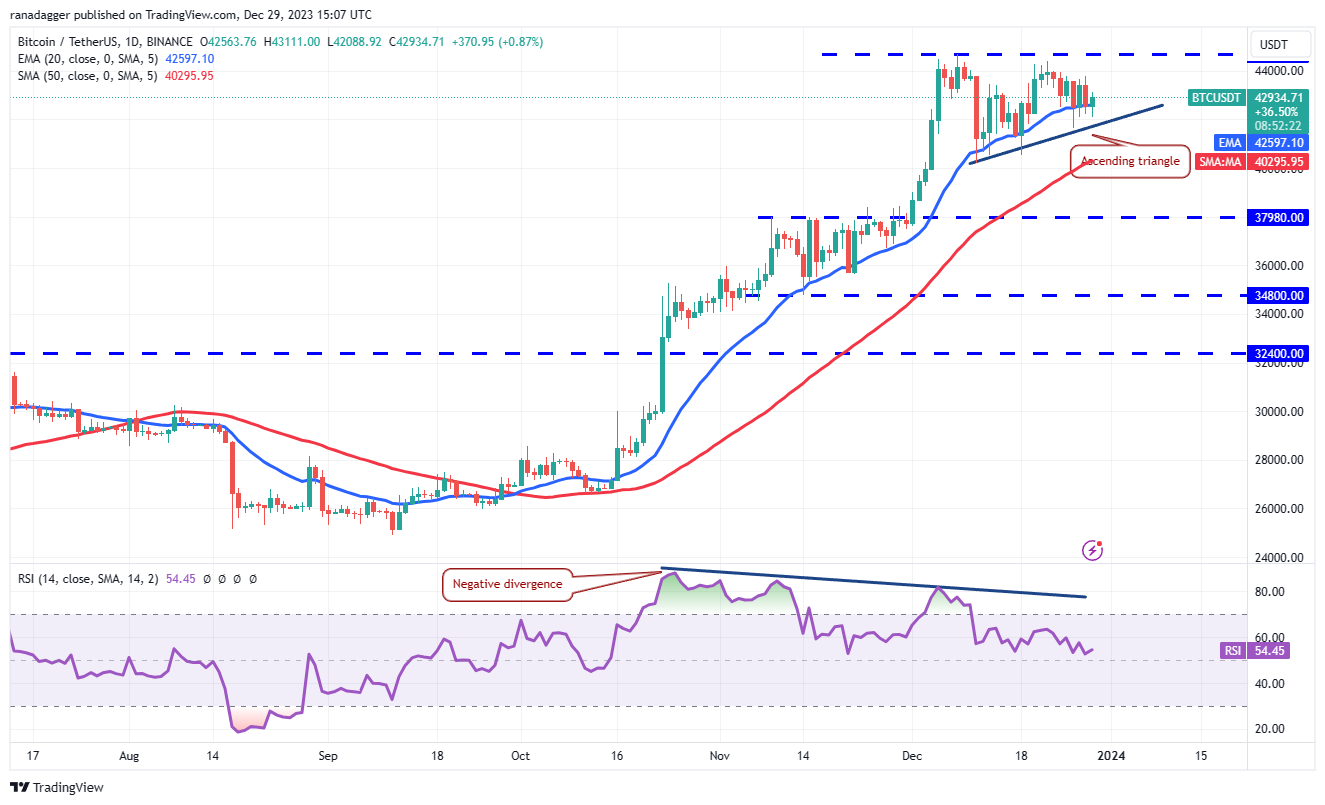
The relative strength index (RSI) has dropped near the midpoint, indicating that the bullish momentum is weakening. Buyers will have to push the price above $44,700 to complete the triangle and regain control. The BTC/USDT pair could then rise to the pattern target of $49,178.
Contrary to this assumpt
Go to Source to See Full Article
Author: Rakesh Upadhyay
Tip BTC Newswire with Cryptocurrency
Donate Bitcoin to BTC Newswire

Donate Bitcoin Cash to BTC Newswire

Donate Ethereum to BTC Newswire

Donate Litecoin to BTC Newswire

Donate Monero to BTC Newswire

Donate ZCash to BTC Newswire
