
The crypto markets are buzzing with the possibility of the spot Bitcoin (BTC) exchange-traded fund seeing the light of the day in January. K33 Research analysts said in a Dec. 19 report that the recent ETF updates about BlackRock and ARK Invest agreeing to a cash-creation setup for their funds signals that an approval is “nailed” for January.
MicroStrategy co-founder Michael Saylor said in an interview with Bloomberg that the approval of the spot Bitcoin ETF “may be the biggest development on Wall Street in 30 years.” The ETF and the Bitcoin halving in April, are expected to lay the stage for “a major bull run for the asset class” in 2024.
Continuing the bullish narrative, Grayscale CEO Michael Sonnenshein said in a CNBC interview that the spot Bitcoin ETF will open the market to “about $30 trillion worth of advised wealth.”
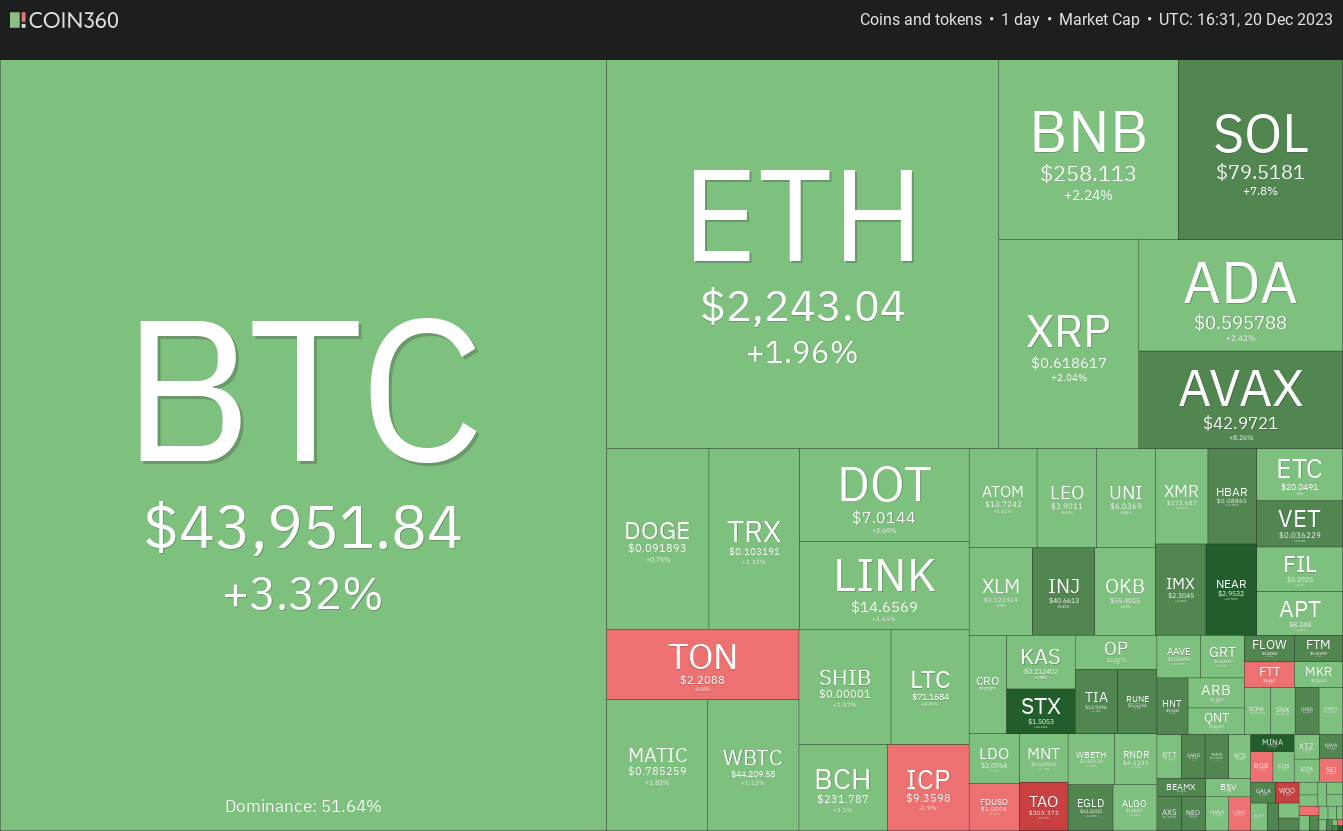
Will Bitcoin and altcoins break above their recent local highs, or will higher levels attract sellers? Let’s analyze the charts of the top 10 cryptocurrencies to find out.
Bitcoin price analysis
Bitcoin dipped below the 20-day exponential moving average ($41,760) on Dec. 18, but the bears could not sustain the lower levels, indicating strong buying on dips.
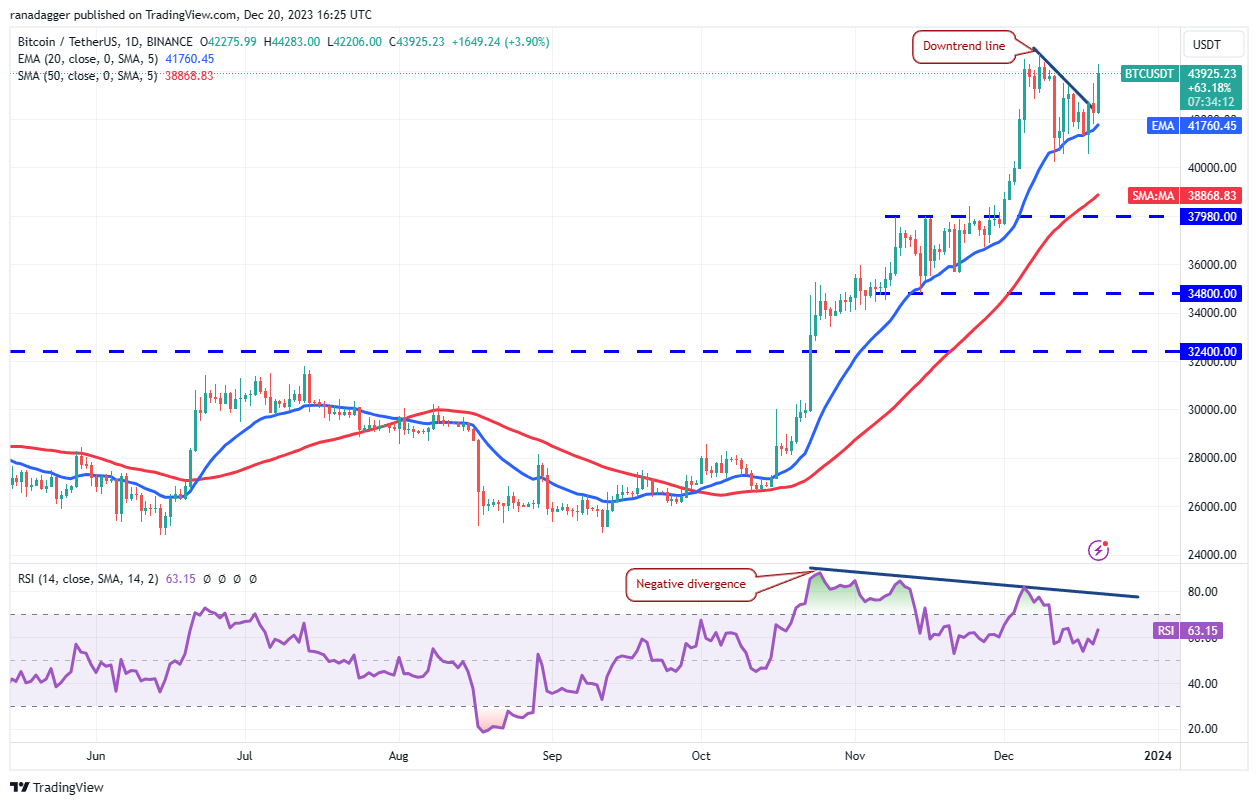
The bulls pushed the price above the downtrend line on Dec. 19, but the bears sold at higher levels. However, renewed buying on Dec. 20 has pushed the price above the immediate resistance at $43,500. This
Go to Source to See Full Article
Author: Rakesh Upadhyay
Tip BTC Newswire with Cryptocurrency
Donate Bitcoin to BTC Newswire

Donate Bitcoin Cash to BTC Newswire

Donate Ethereum to BTC Newswire

Donate Litecoin to BTC Newswire

Donate Monero to BTC Newswire

Donate ZCash to BTC Newswire
