
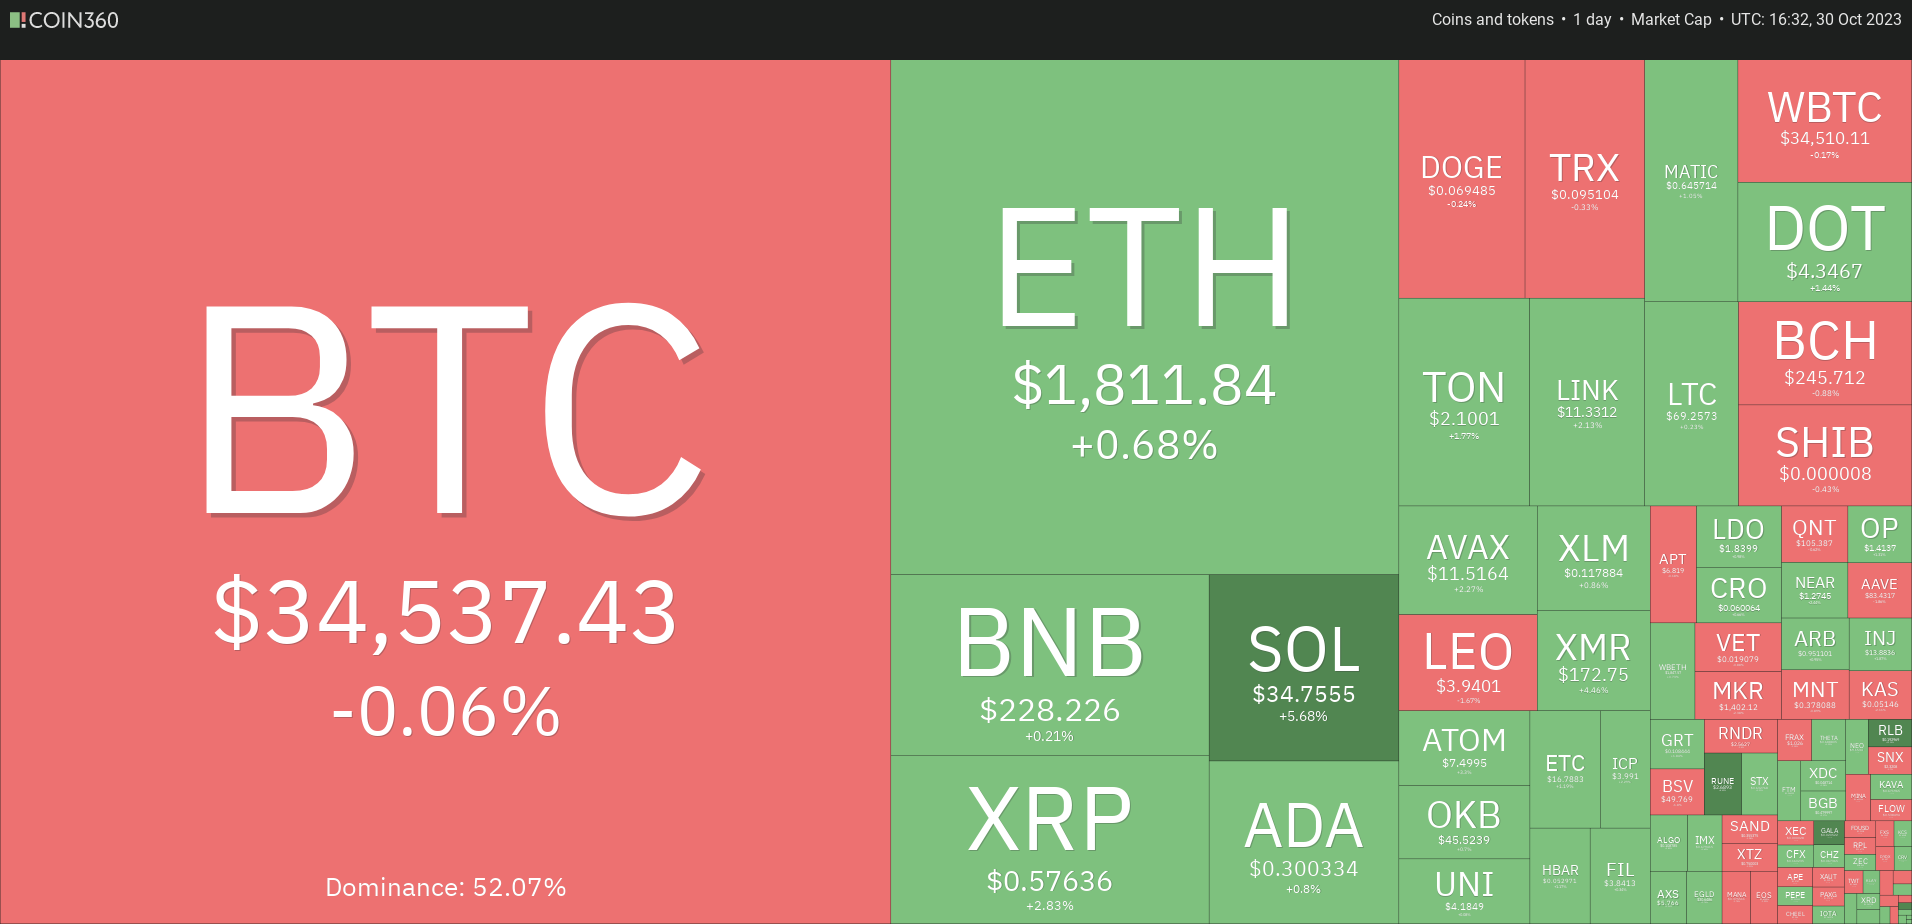
Bitcoin’s reluctance to give up ground has attracted strong buying in select altcoins.
Bitcoin (BTC) price climbed by 15% last week and 10.45% the week before. The S&P 500 Index dropped 2.53% last week and 2.39% the week before. This shows that Bitcoin has decoupled from the S&P 500 Index in the short term and may chart its own course.
However, the path higher may not be easy. The Federal Open Market Committee’s meeting on Nov. 1 may cause some volatility, but it will li be short-lived as no surprises are expected. CME’s FedWatch Tool projects a 98% probability that rates will remain unchanged.
A large part of the gains in Bitcoin have been fuelled by expectations that the United States Securities and Exchange Commission will approve a spot Bitcoin exchange-traded fund in the near future. Any adverse news in this regard may prove to be a major setback for the bulls. When traders start chasing prices higher, it increases the risk of a short-term pullback.
What are the important support levels on Bitcoin and altcoins that need to hold for the sentiment to remain bullish? Let’s analyze the charts to find out.
S&P 500 Index price analysis
The S&P 500 Index (SPX) remains in a strong downtrend. The price is close to the strong support zone between 4,050 and 4,100.
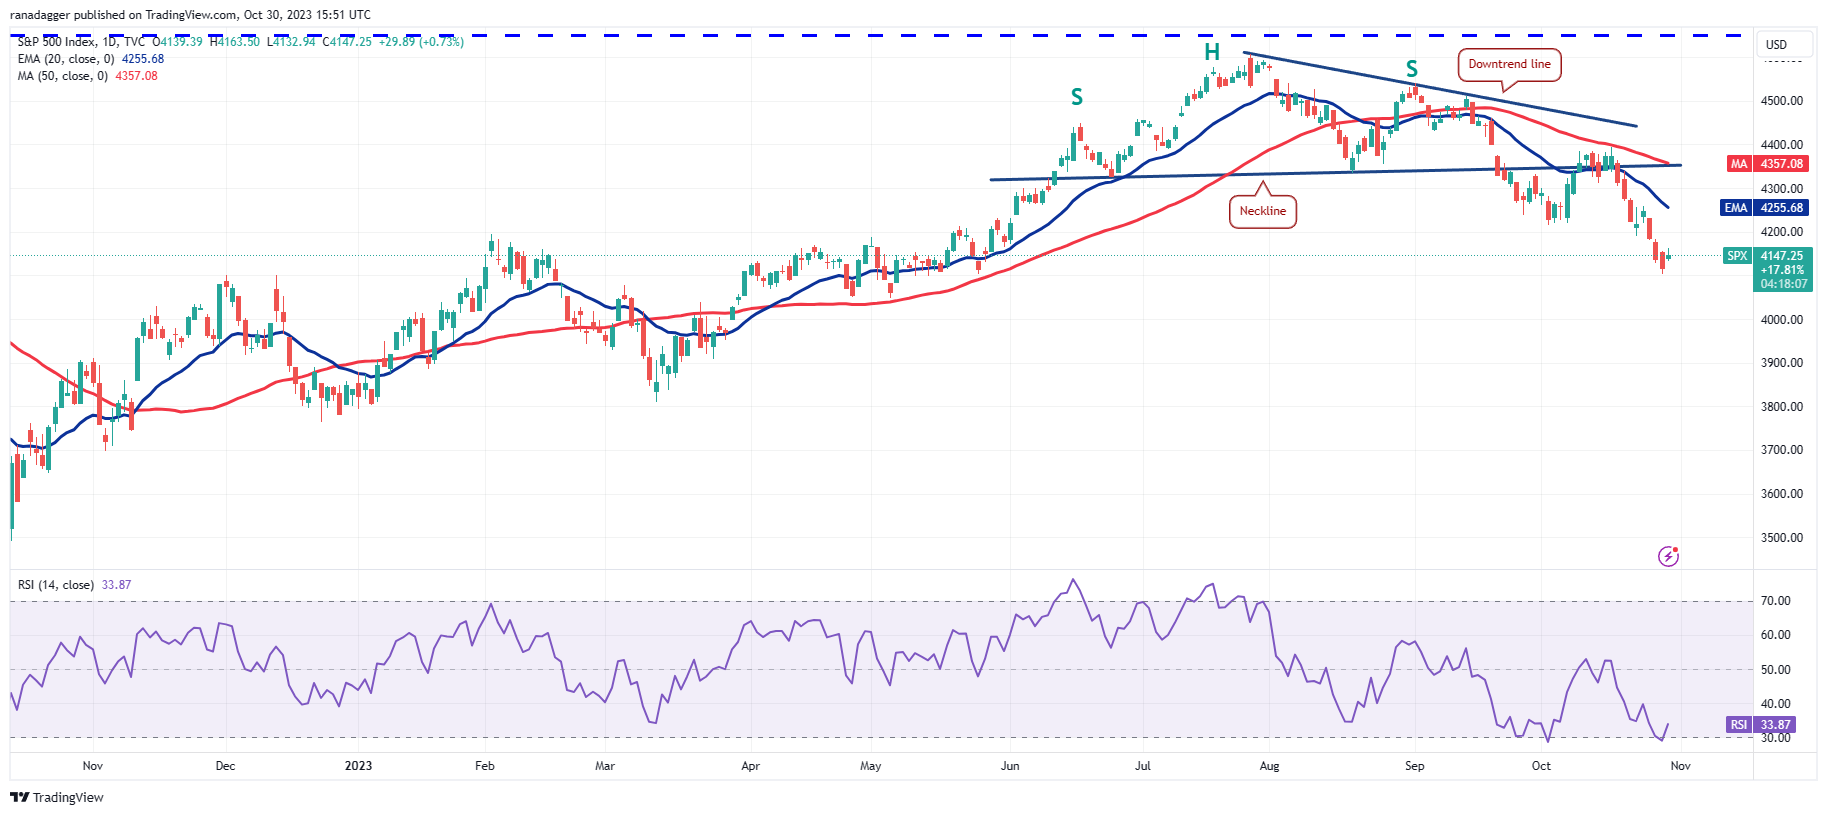
The sharp fall of the past few days pushed the relative strength index (RSI) into the oversold territory, suggesting that a pullback may be possible. On the upside, the bears are expected t
Go to Source to See Full Article
Author: Rakesh Upadhyay
Tip BTC Newswire with Cryptocurrency
Donate Bitcoin to BTC Newswire

Donate Bitcoin Cash to BTC Newswire

Donate Ethereum to BTC Newswire

Donate Litecoin to BTC Newswire

Donate Monero to BTC Newswire

Donate ZCash to BTC Newswire
