
Bitcoin’s (BTC) volatility has increased in the past two days as traders speculate about the fate of the spot Bitcoin exchange-traded funds (ETFs) applications. Some analysts said that the ETFs could be greenlighted as early as Jan. 5, but Bloomberg ETF analyst James Seyffart is standing by his belief that an approval is most likely to happen between Jan. 8 and 10.
A few analysts believe that in a classic case of buy the rumor, sell the news, Bitcoin may fall even if one or more Bitcoin ETFs are approved. But John Bollinger, creator of the Bollinger Bands volatility indicator, thinks otherwise. In a post on X (formerly Twitter), Bollinger said he expects Bitcoin to “break higher.”
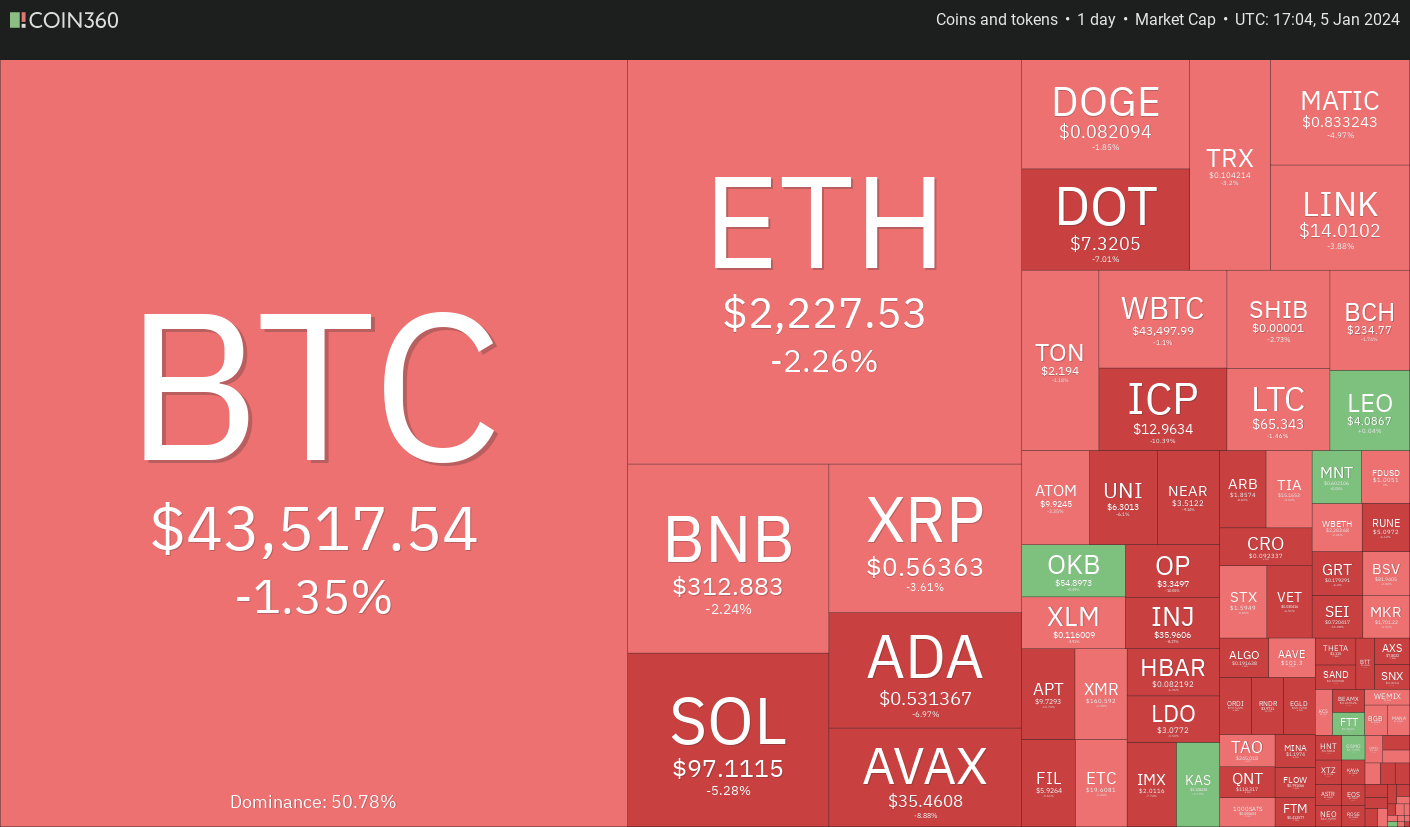
What are the important resistance levels to watch out for in Bitcoin and altcoins? Let’s analyze the charts of the top 10 cryptocurrencies to find out.
Bitcoin price analysis
Bitcoin climbed back into the ascending triangle pattern on Jan. 3, suggesting that the sharp fall to the 50-day simple moving average ($41,205) may have been a bear trap.
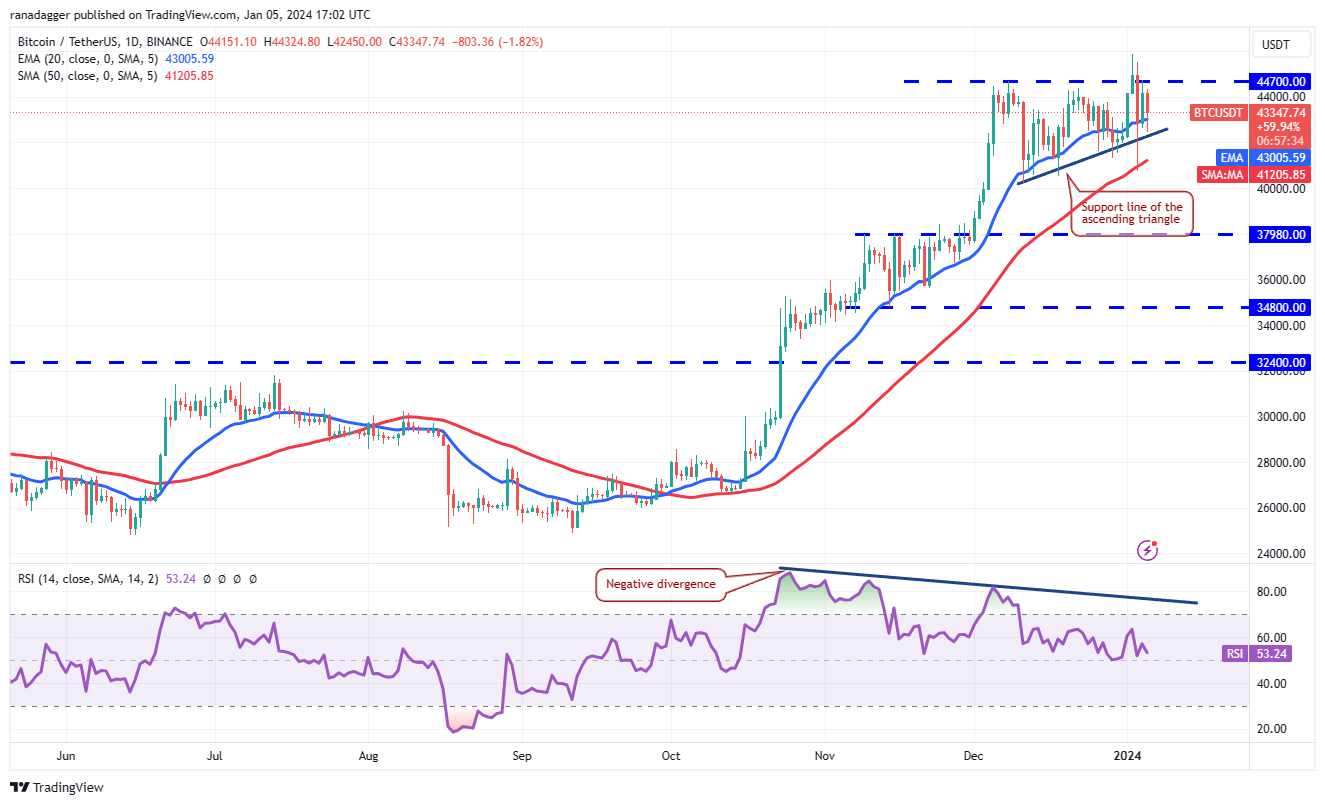
The bulls will try to strengthen their position by shoving the price above the $44,700 resistance. If they do that, the BTC/USDT pair will complete the bullish setup. That could start a rally to the overhead resistance zone between $50,000 and $52,000.
If bears want to prevent the upside move, they will have to drag the price back below the triangle. There is a minor support at $40,000, but if the price skids below this level, the decline could extend to $37,980.
<
Go to Source to See Full Article
Author: Rakesh Upadhyay
Tip BTC Newswire with Cryptocurrency
Donate Bitcoin to BTC Newswire

Donate Bitcoin Cash to BTC Newswire

Donate Ethereum to BTC Newswire

Donate Litecoin to BTC Newswire

Donate Monero to BTC Newswire

Donate ZCash to BTC Newswire
