- POPCAT’s value depreciated by 5.37% in the last 24 hours
- Market indicators pointed to a shift in market sentiment from bullish to bearish
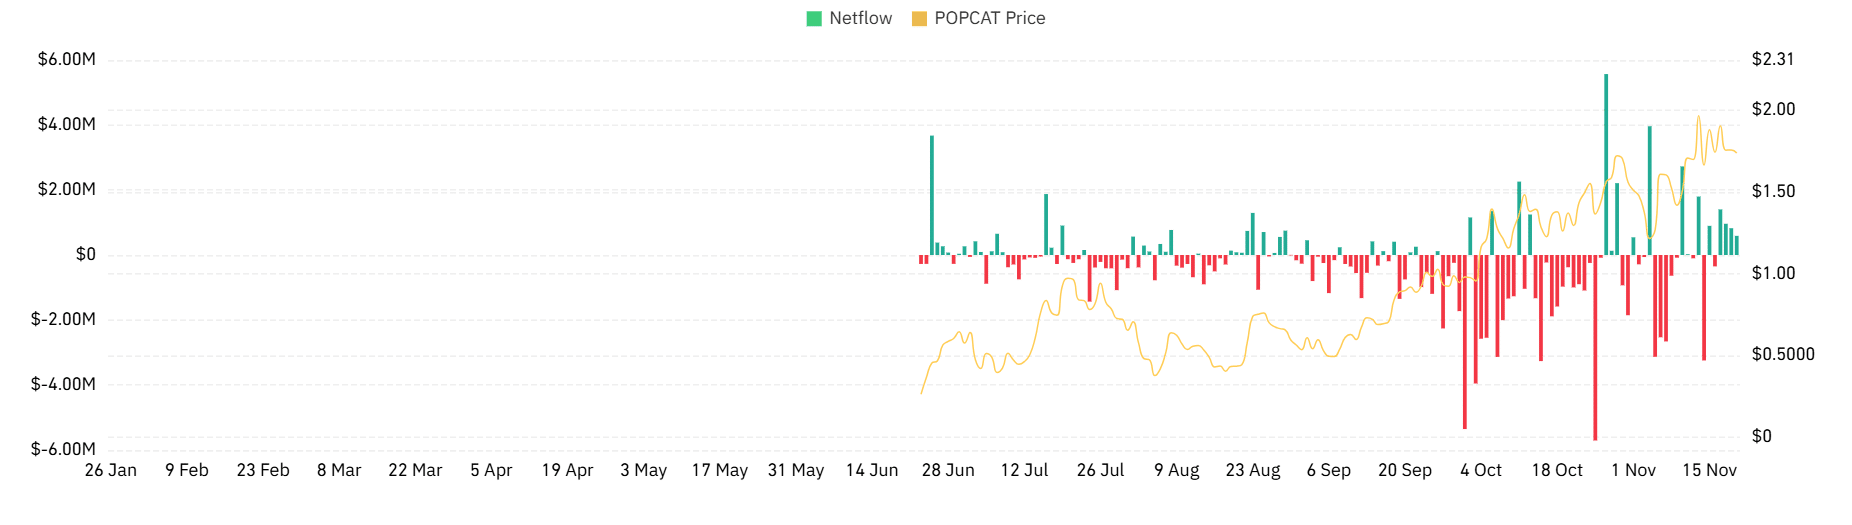
Earlier in the month, the wider crypto market registered a major upswing. Owing to the same, most of the market’s memecoins surged to hit recent new highs and ATHs. POPCAT was no different, with the altcoin hiking to hit a new ATH of $2.07 on the charts.
Since then, however, the memecoin has seen a strong trend reversal – A sign of a potential downtrend.
At the time of writing, POPCAT was trading at $1.72 following a 5.37% decline over the last 24 hours. What this suggested was that after hitting $2.07 three days ago, the memecoin declined by 22.71%. Prior to the same, the crypto had been on an upward trajectory. It had by 19.55% on the weekly charts and by 24.64% on the monthly charts.
Hence, the question – Is the decline a mere correction or is the market set for a further downtrend?
What does POPCAT’s chart say?
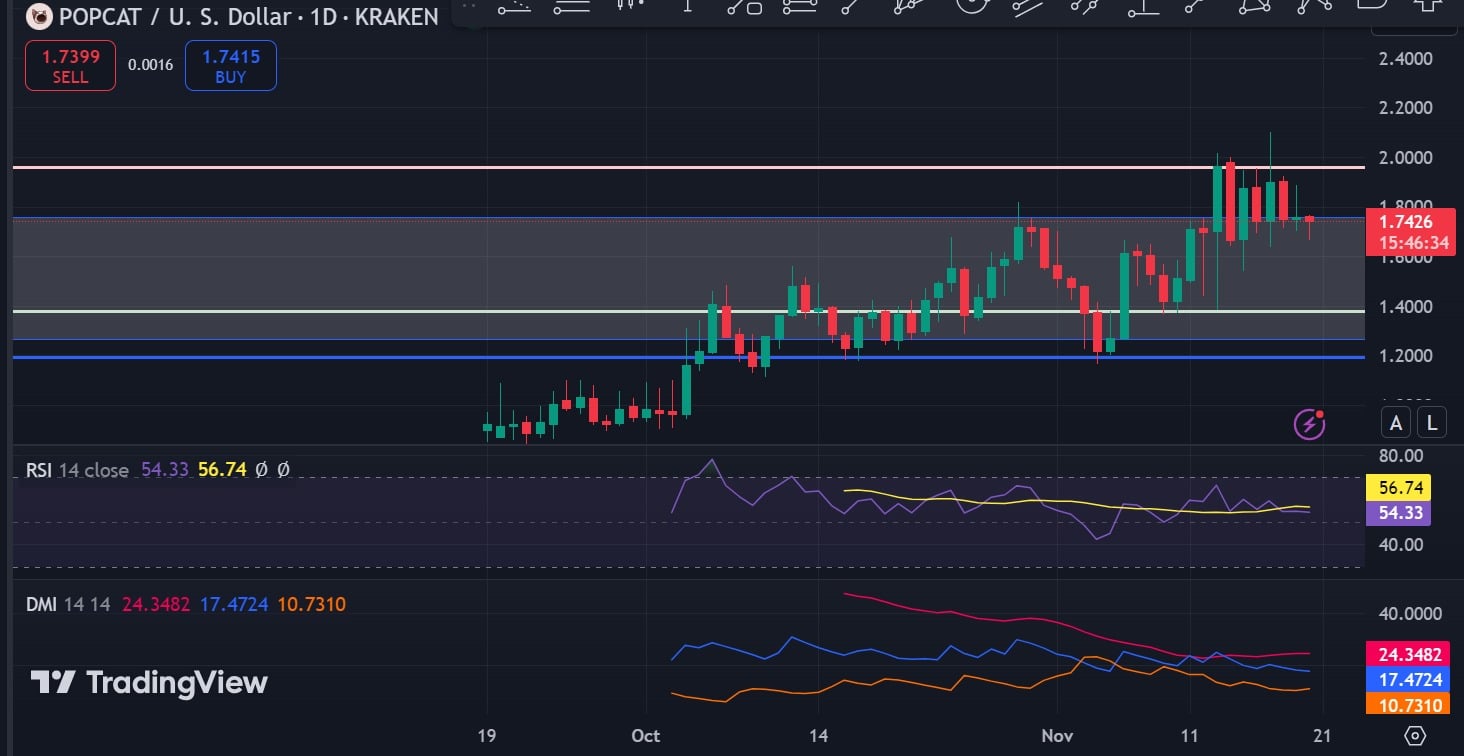
According to AMBCrypto’s analysis, POPCAT, at press time, was noting a shift in market sentiment from bullish to bearish thanks to rising selling pressure.
Source: Tradingview
Such a shift can be evidenced by the fact that POPCAT’s Relative Strength Index (RSI) declined from 66 to 53 over the last 7 days. Also, the RSI-based MA flashed a bearish crossover to sit above its RSI at 56.
This suggested that the memecoin is currently facing strong selling pressure and sellers have been dominating the market. A hike in selling pressure often leads to a price decline on the charts.
The risk of a price decline can be further evidenced by a declining +DI, with the same dropping to 17 after a bearish crossover left the ADX at 24. This implied that the altcoin’s uptrend lost some momentum while bearish pressure across the market strengthened.