
After peaking at $75,000 in mid-March, Bitcoin is back again in the hands of sellers, trading at $67,620.16 at press time. Such volatility has led bettors on prediction markets to predict Bitcoin’s future price.
However, the prediction market is also divided on this, as Kalshi predicted,

Meanwhile, Polymarket predicted that “Bitcoin is now likely to crash below $45,000 this year”, with a 52% chance of this happening.

Additionally, a closer look at Polymarket reveals a 43% chance of Bitcoin surpassing $90,000, while nearly 75% of bettors anticipate a fall below the $55,000 price level.
Elon Musk’s Bitcoin tease
This comes as Elon Musk, mostly known for posting about Dogecoin [DOGE], has made an interesting Bitcoin [BTC] tease.
In his X post, Musk attached a 5-minute clip of an anime girl dancing with a Bitcoin logo behind her. Unlike Dogecoin, which usually surged after Musk’s post, Bitcoin didn’t flinch.
In fact, the price of Bitcoin traded near the $67,000 before and after his post.

With so much chatter around Bitcoin’s price, naturally, the crypto community also seemed conflicted.
Crypto community remains divided
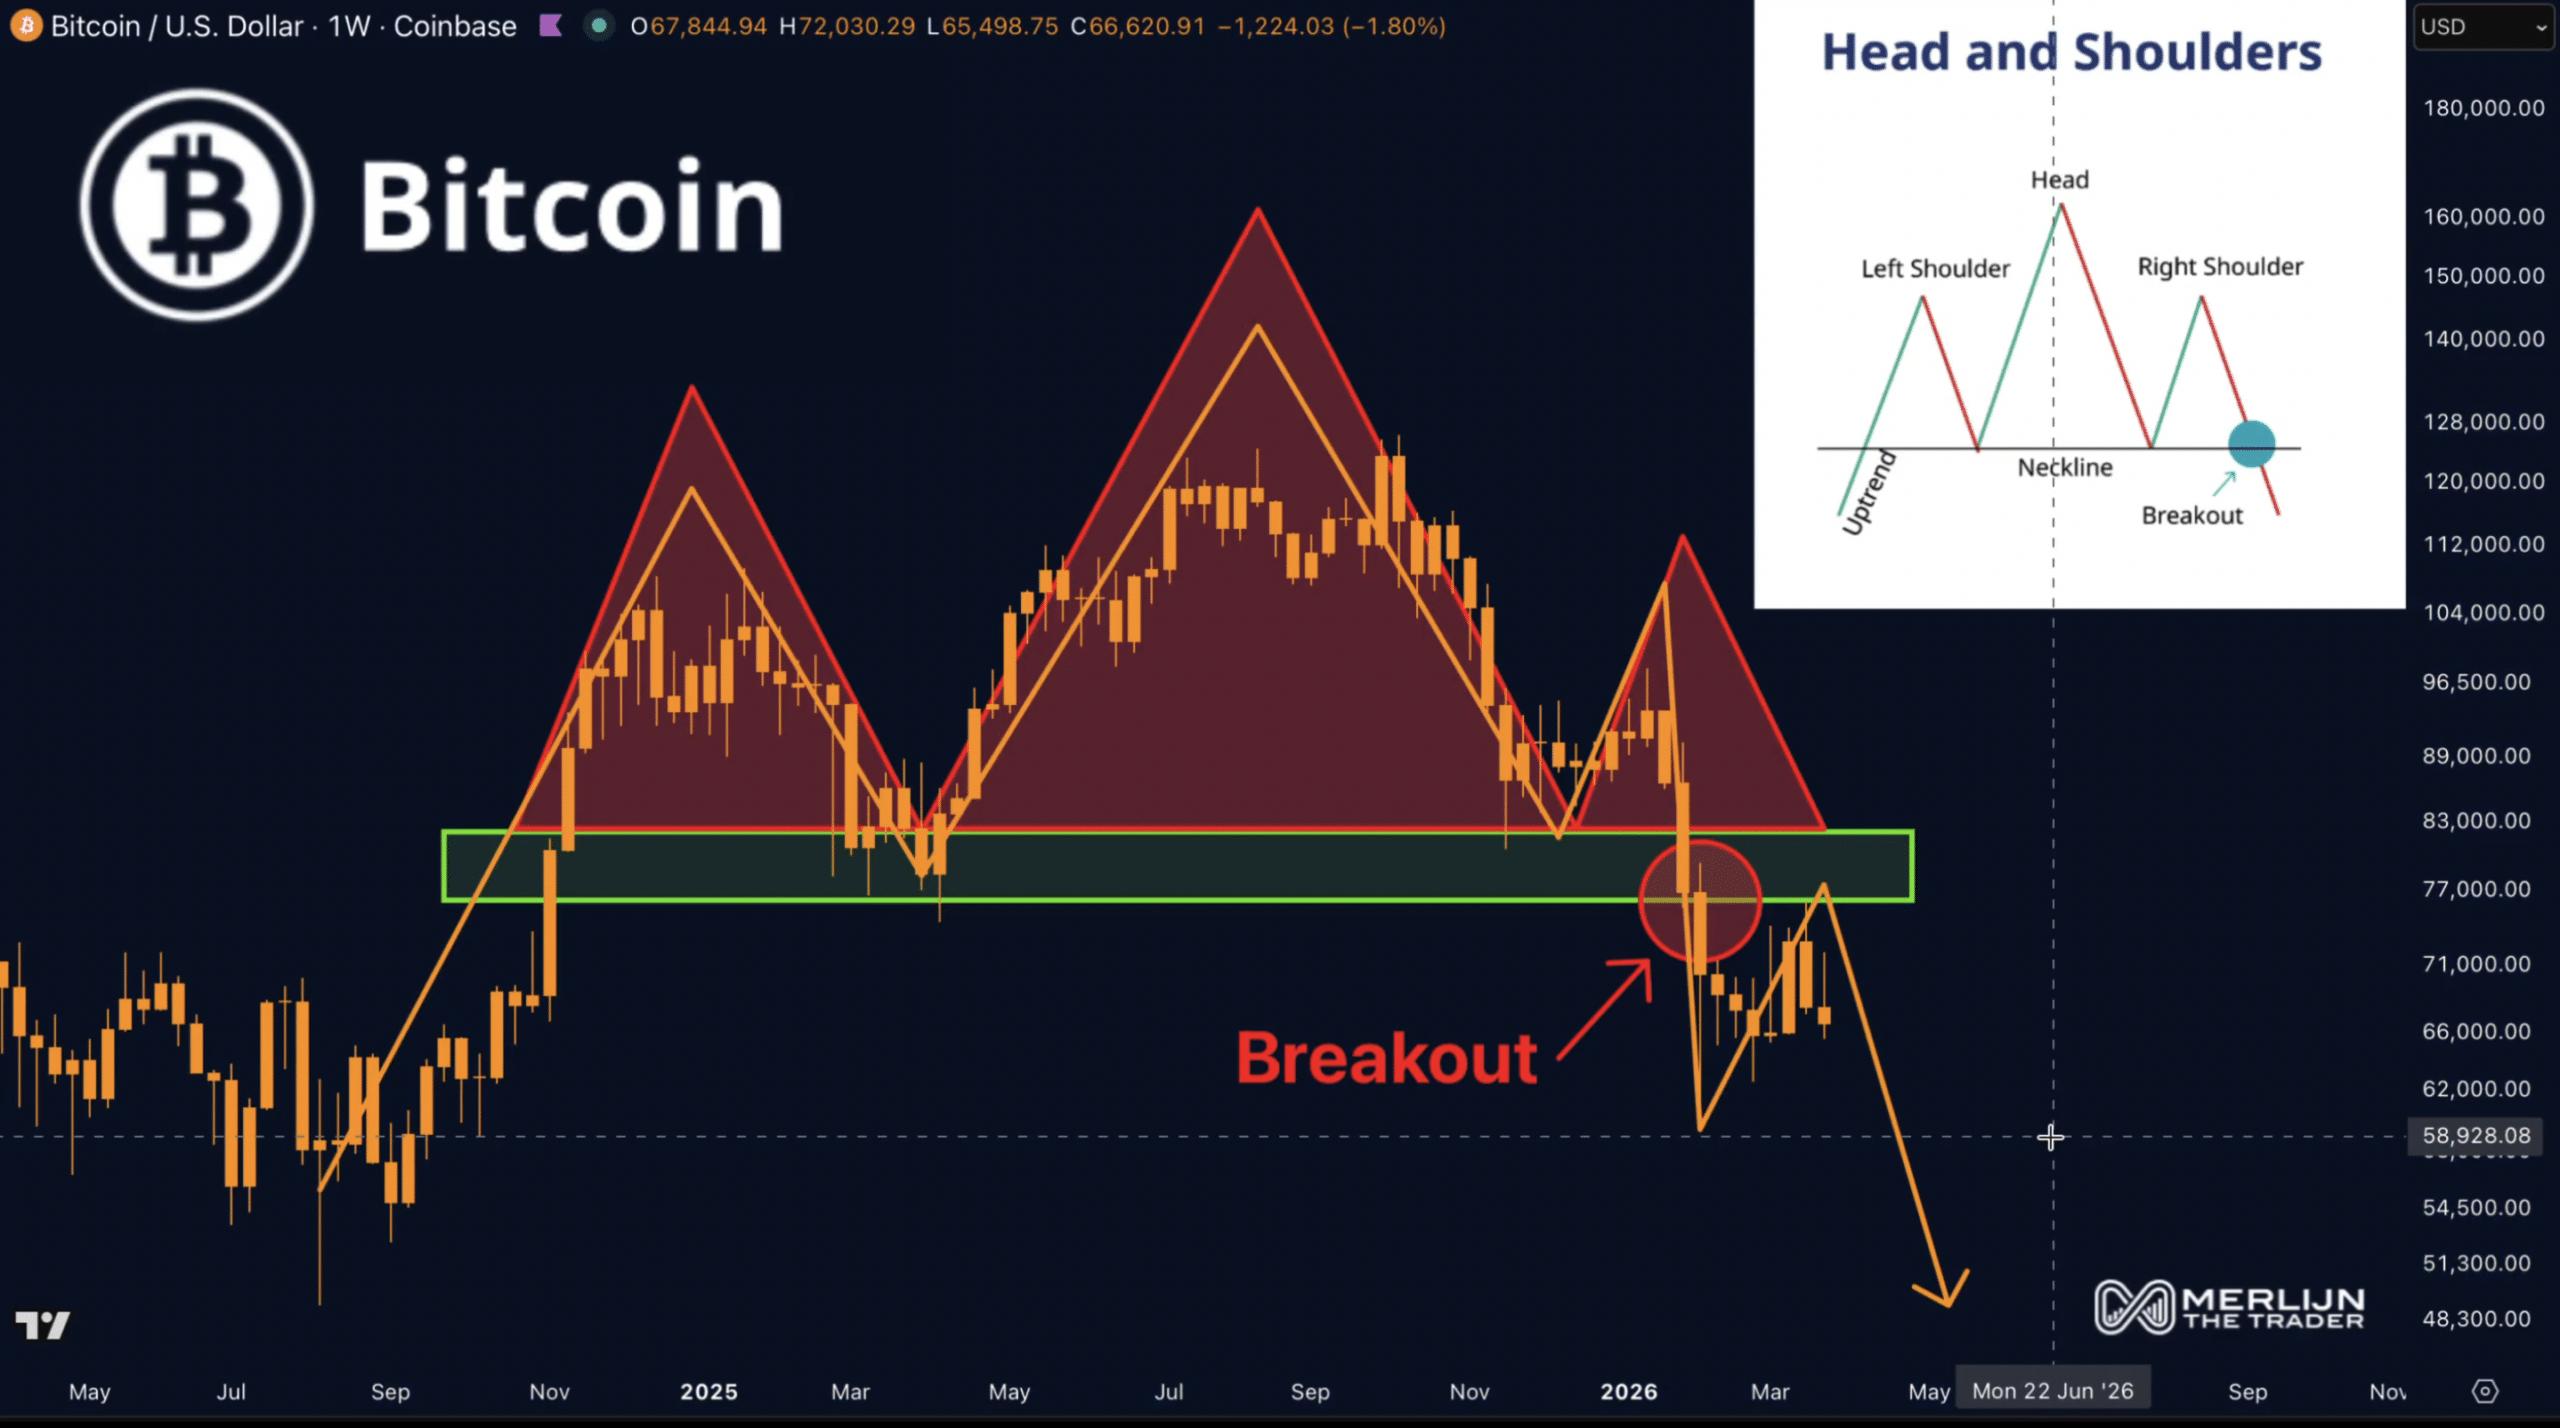
For instance, a trader using the Head and Shoulders pattern confirmed the bearish sentiment, noting that BTC is likely to move towards $48K provided it remains below the $77K price level.
However, a move above the $83K level will reverse the market back in the hands of the buyers.
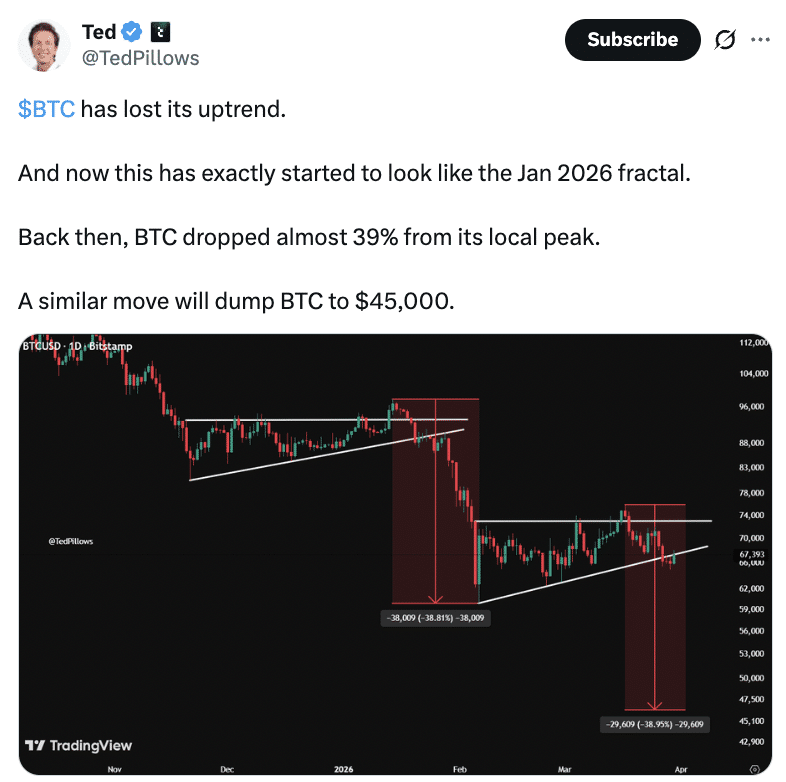
Adding more weight to the ongoing FUD, another analyst predicted that Bitcoin is likely to go down to $45,000.
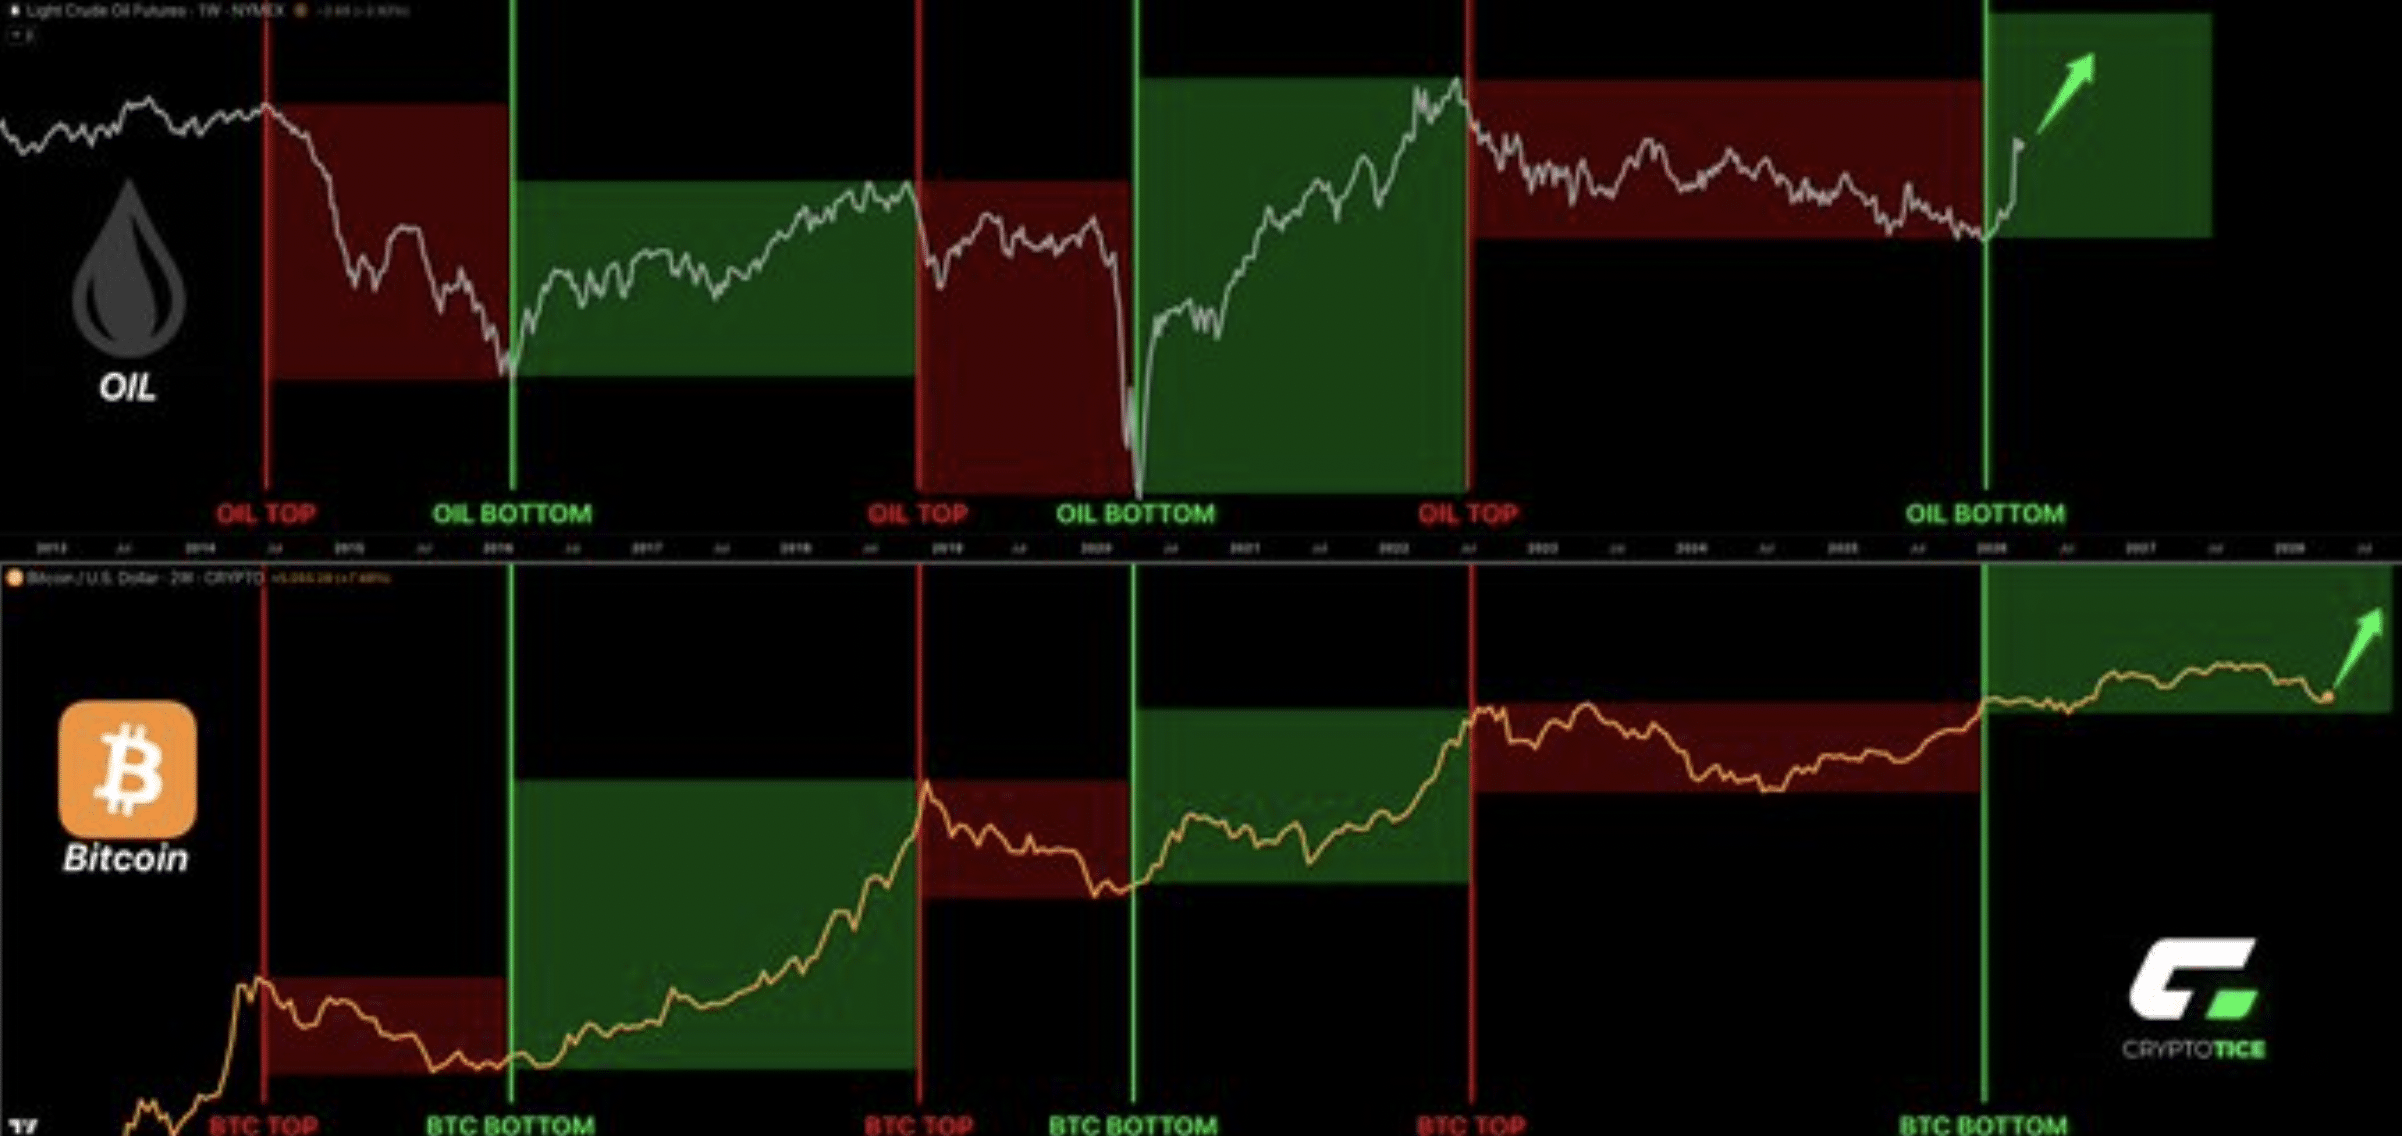
However, not everyone was sharing similar sentiments, as another analyst drew a comparison between Bitcoin and oil prices and noted,
Every single Bitcoin parabolic phase in history was preceded by an oil bottom.
On-chain metrics are juggling between bulls and bears
This tug of war between bulls and bears was further reflected in the price chart, where the technical indicator – RSI stood at the 50 level mark, suggesting that neither bulls nor bears are in favour.
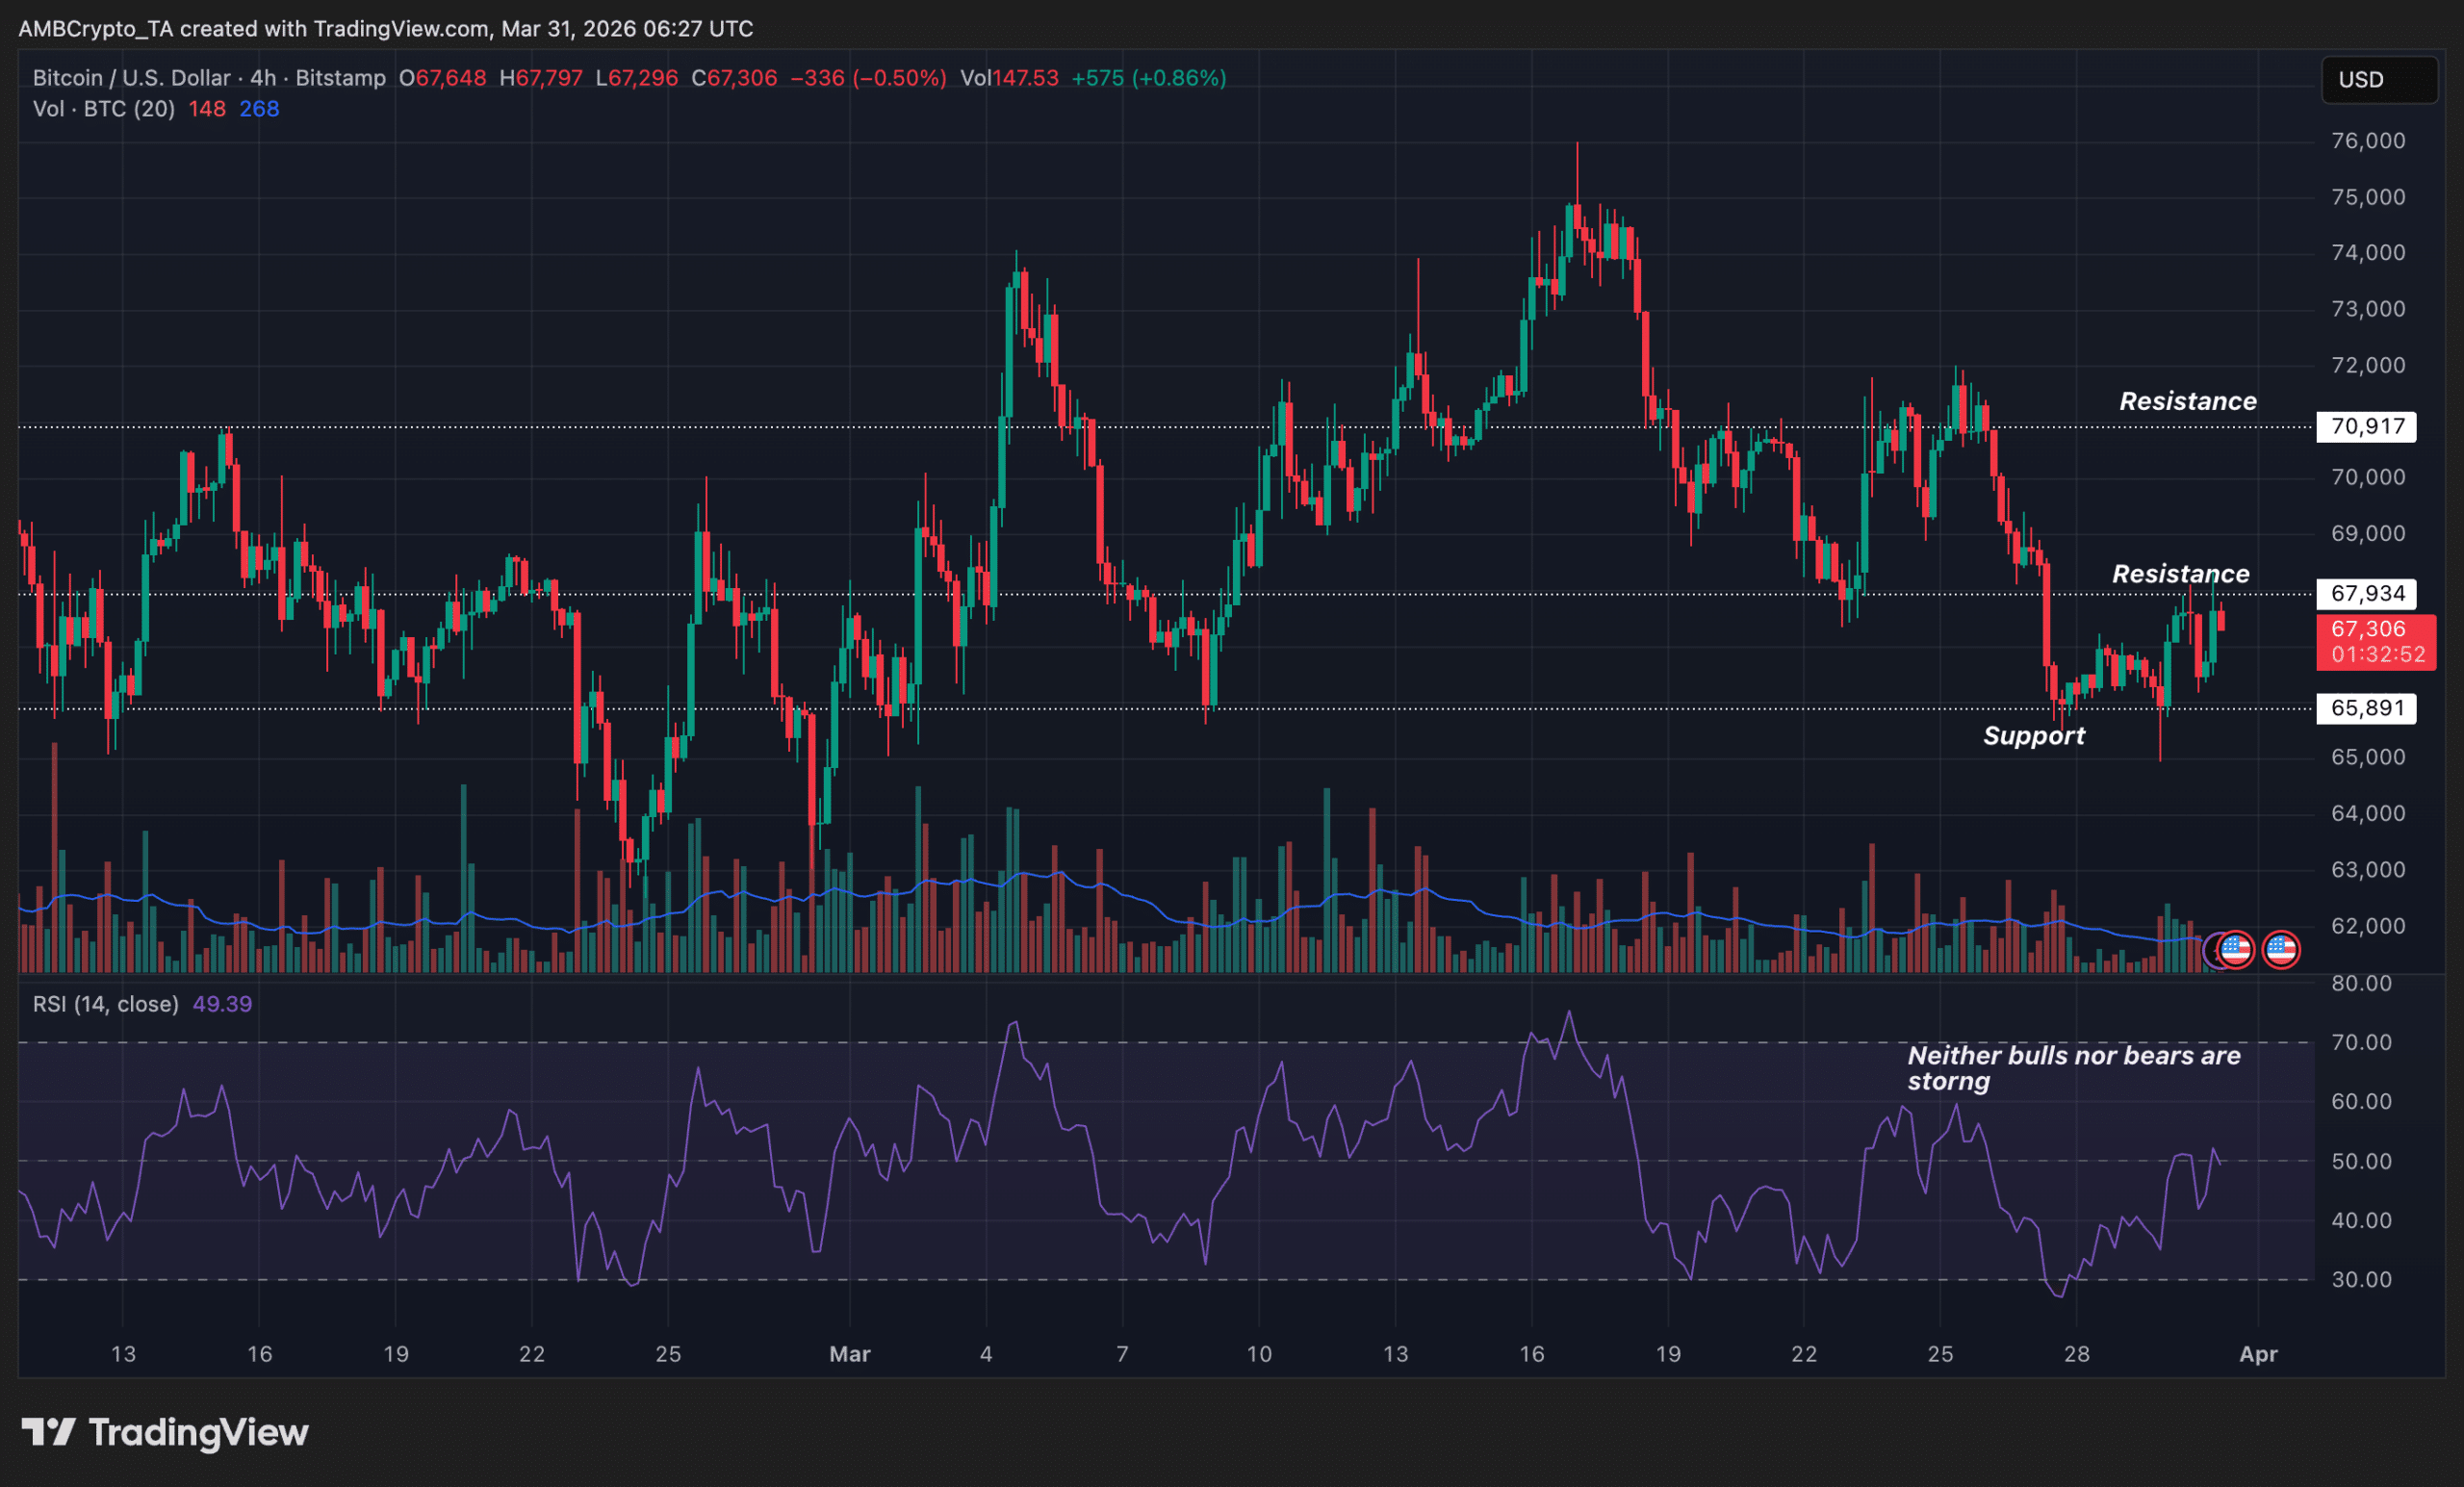
Hence, for a true bull run, BTC needs to break above the resistance level at $70,917 and move further ahead. However, a fall below the support level at $65,000 will pull the price down into the hands of the sellers.
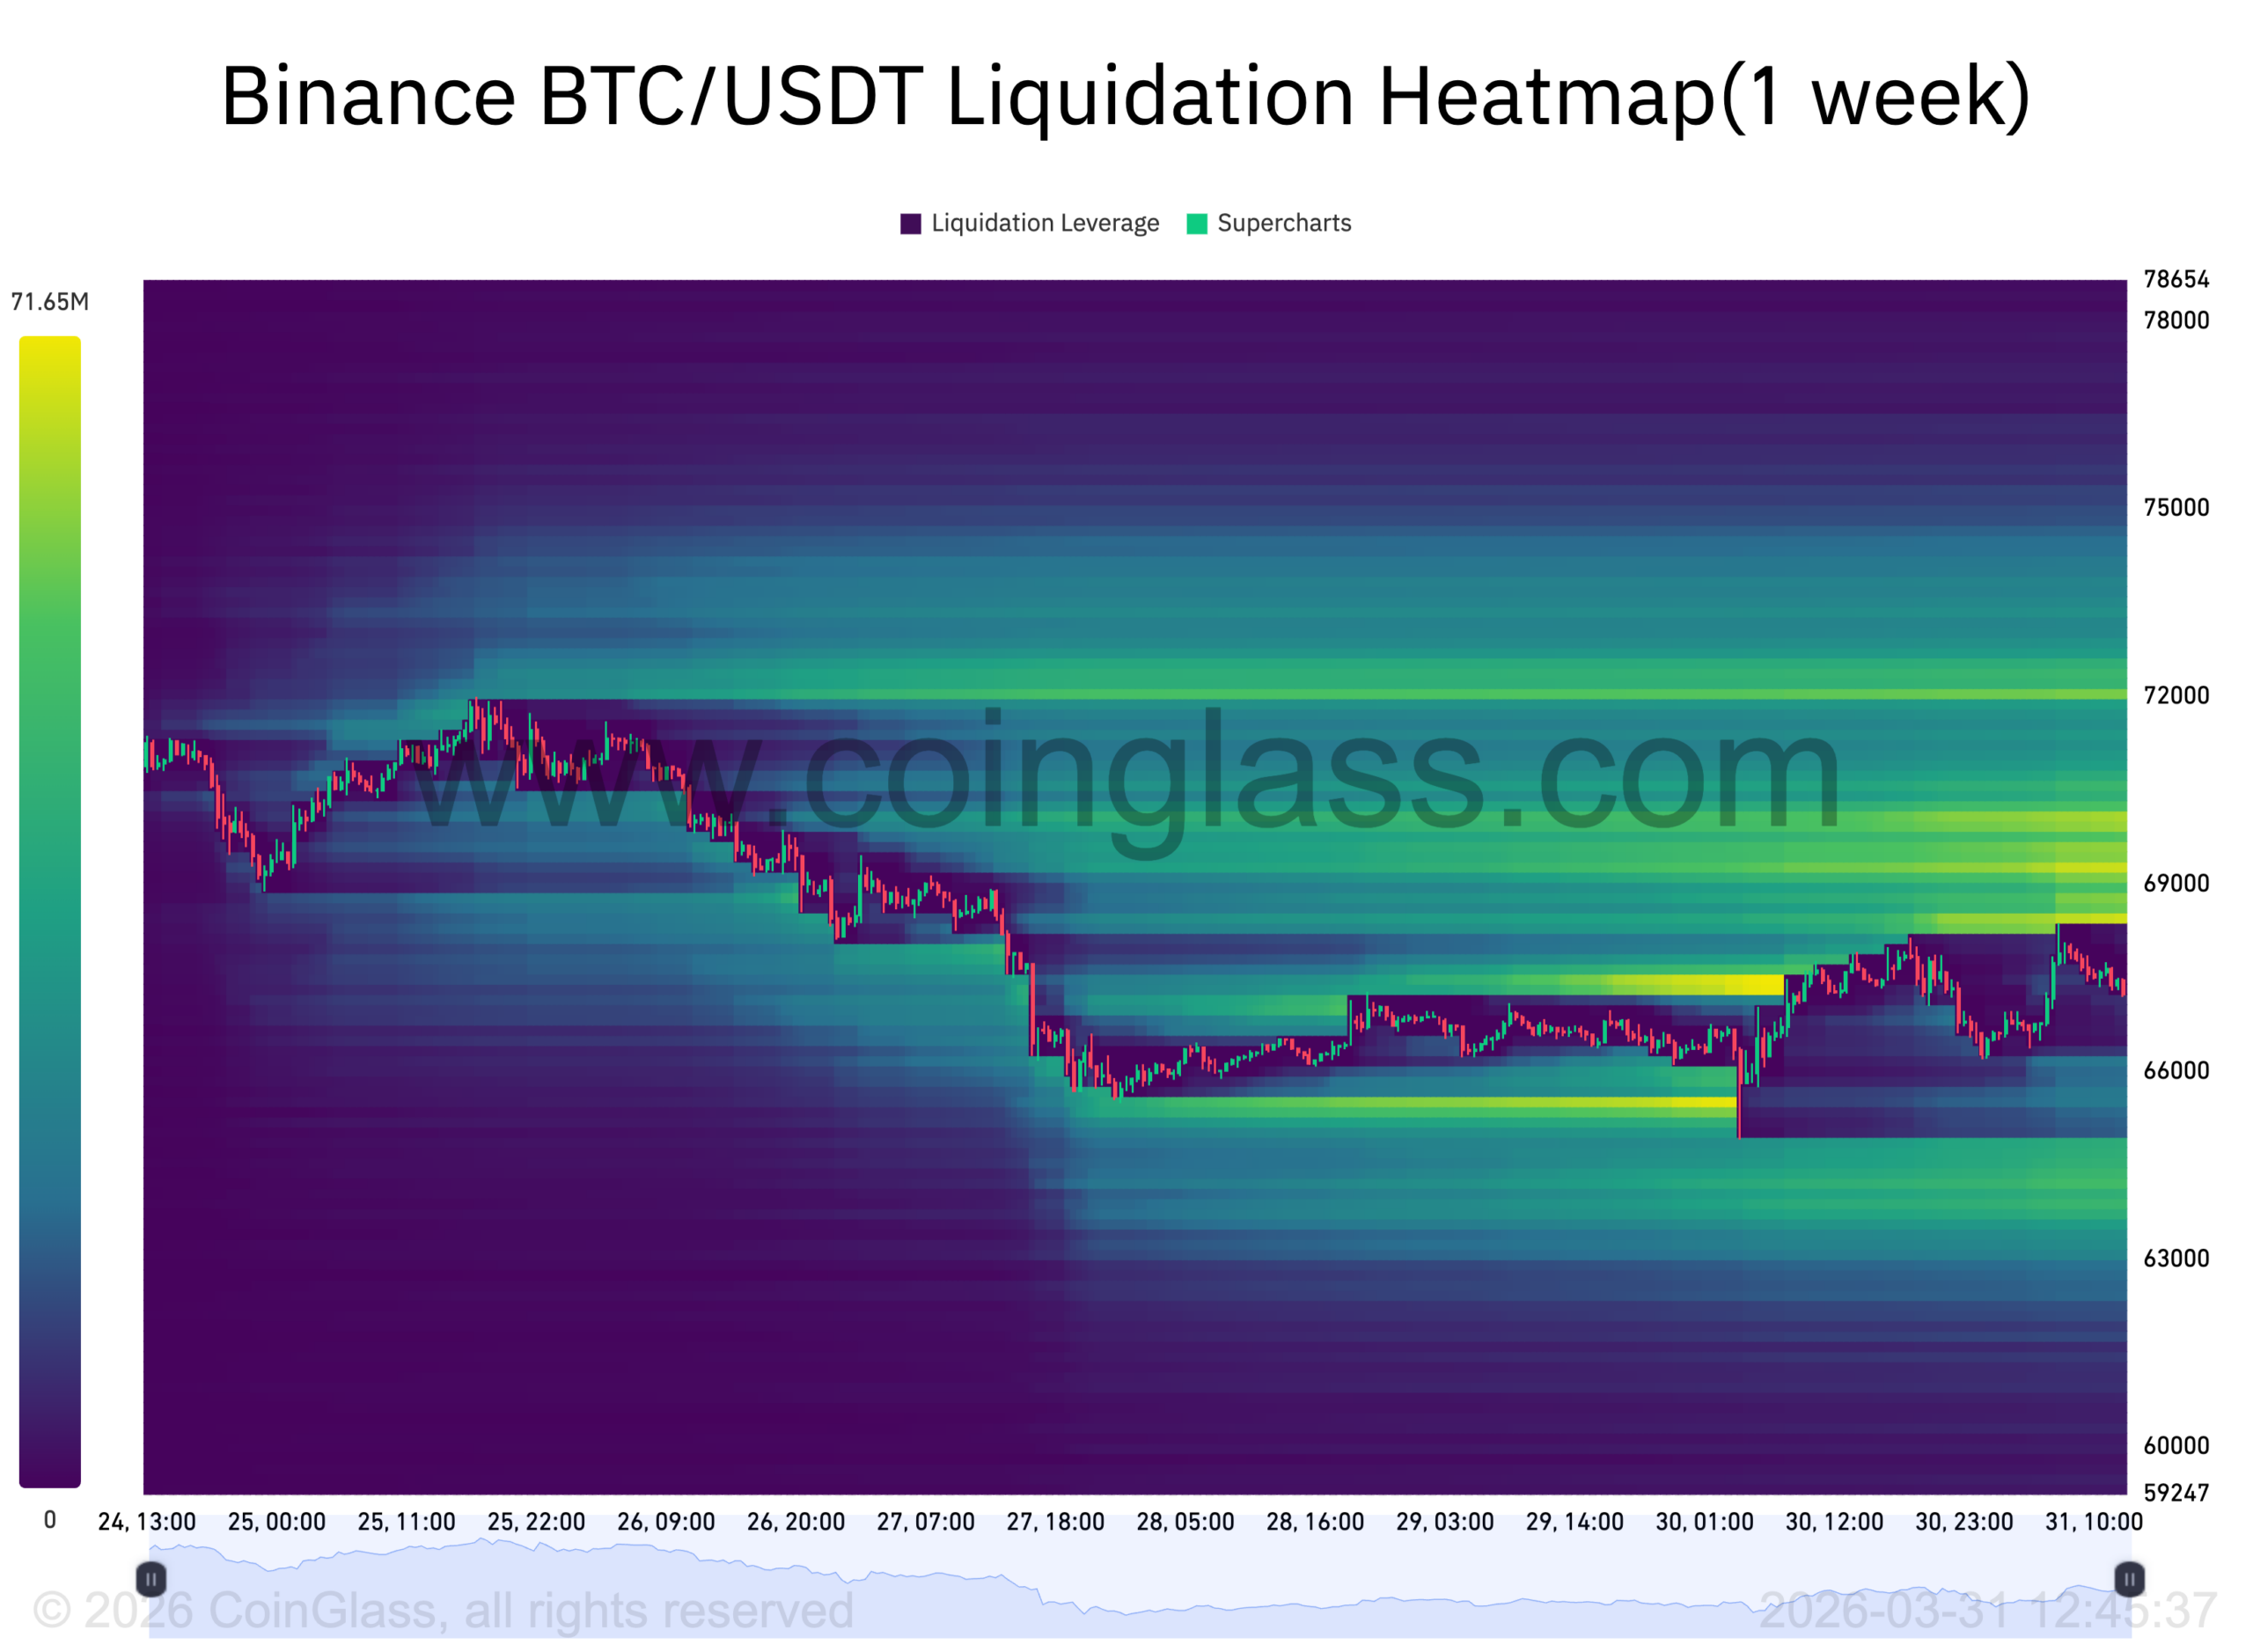
The same is happening with the liquidity heatmap, wherein the longer time frame of 1 month and 3 months suggests that the price is likely to fall near the $64,000 magnetic zone.
However, the closer time frames of 1 week and 24 hours show that a strong magnetic zone lies near the $68,00 mark.
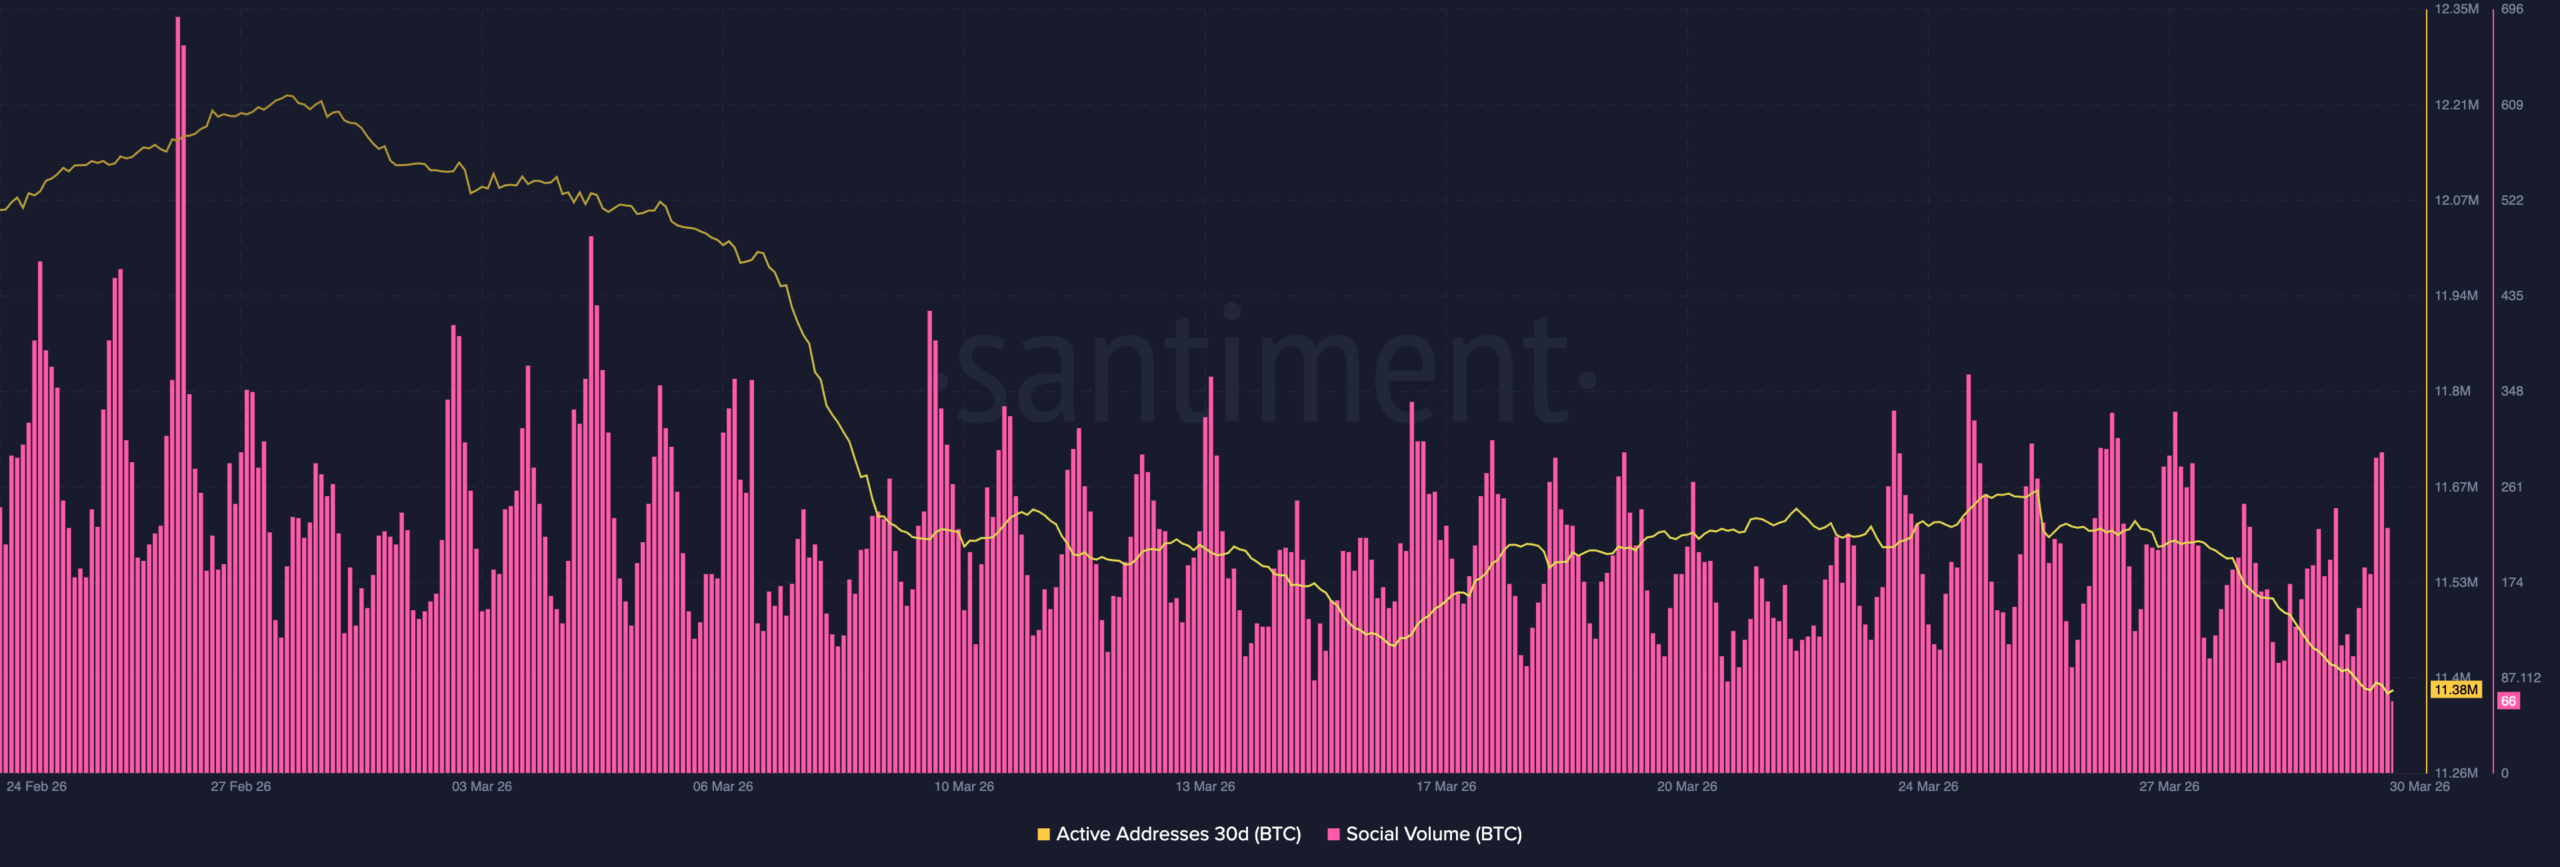
Additionally, the drop in 30-day active addresses also suggests that on-chain and user activity are also low. Meanwhile, the social volume metric with multiple spikes notes that people might be talking about BTC, but whether it’s negative or positive is unknown.
This followed a recent prediction by Polymakret, wherein the bettors claimed the same thing, noting,
Bitcoin is now more likely to crash below $45,000 than to reclaim $100,000 this year.
Final Summary
- Technical indicators sitting near the neutral level zone are causing more uncertainty in the market.
- On-chain metrics with no strong bull signs suggest that bulls are struggling to regain control against the bears.
Go to Source to See Full Article
Author: Ishika Kumari