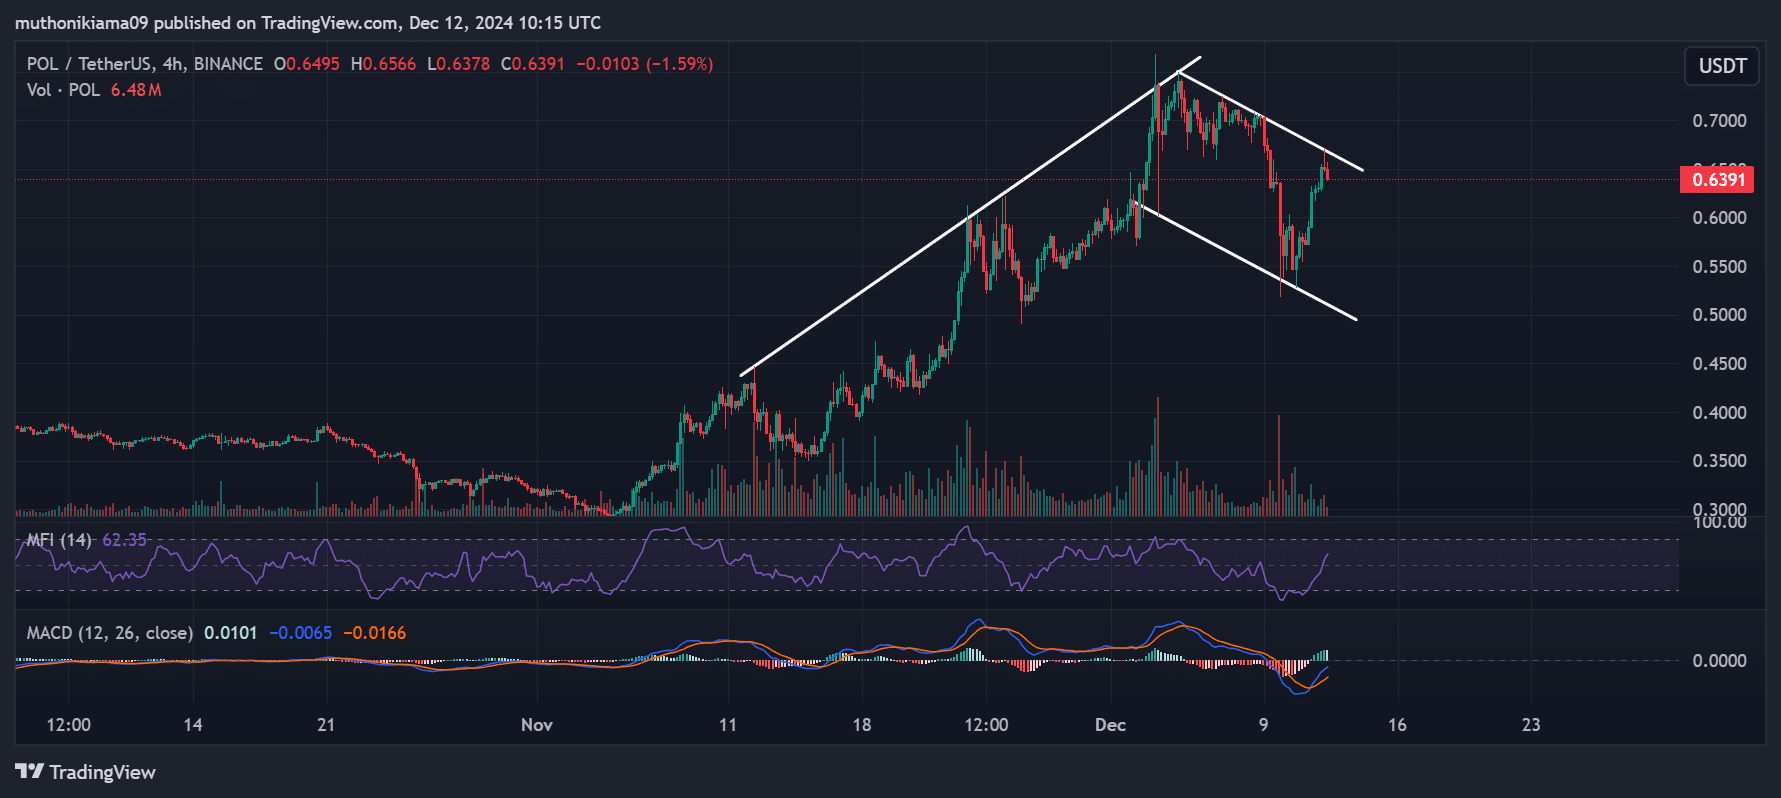
- POL appears to have formed a bull flag on its four-hour chart suggesting an upcoming uptrend.
- This uptrend could face resistance given that a majority of holders are yet to become profitable.
Polygon [POL] traded at $0.655 at press time, after an 11% gain in 24 hours. These gains are a reversal from bearish trends, given that the price remains down by 7% in the last seven days.
Polygon, like most altcoins, recorded a strong uptrend in late November, before hitting a snag earlier this month. This uptrend and the subsequent drop formed a bull flag on POL’s four-hour chart.
This pattern suggests that POL could continue its uptrend, but more buying volumes are needed to support a breakout.
Source: Tradingview
The volume histogram bars depict minimal buying and selling activity. However, the Money Flow Index (MFI) index suggests that buying activity is increasing after a rise to 62.
The Moving Average Convergence Divergence (MACD) also shows that bulls are regaining control after the MACD histogram bars flipped green, an indication of rising buying activity.
At the same time, the MACD line on this lower timeframe is in an uptrend, and if it crosses above the signal line, it will be a confirmation of short-term bullishness.
Key levels to watch
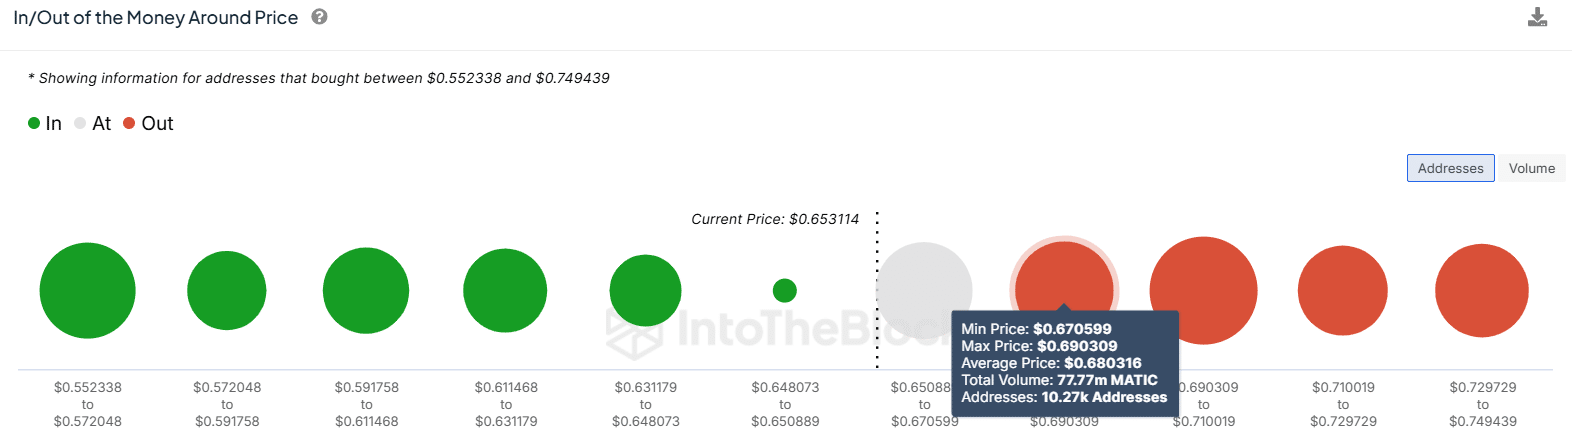
The In/Out of the Money Around Price (IOMAP) metric from IntoTheBlock shows that nearly 10,000 addresses bought POL between $0.65 and $0.67. This price zone could act as a support level, with a drop below set to cause a downturn.