Disclaimer: The information presented does not constitute financial, investment, trading, or other types of advice and is solely the writer’s opinion.
- The daily market structure of MATIC was bearish.
- The lack of a strong reaction from the $1 area meant demand for MATIC was weak.
On 15 April, the momentum of MATIC on the price charts appeared to flip bullish, but this was reversed just a few days later. Thereafter the price dropped from $1.18 to $0.95 on 26 April. Since then, neither the bulls nor the bears were able to force a strong move for MATIC.
Read Polygon’s [MATIC] Price Prediction 2023-24
While the lower timeframe charts showed a range formation just beneath the $1 level, the bearish pressure seen on the higher timeframe charts could eventually force another move downward for MATIC.
The market structure was bearish and the bulls could be exhausted
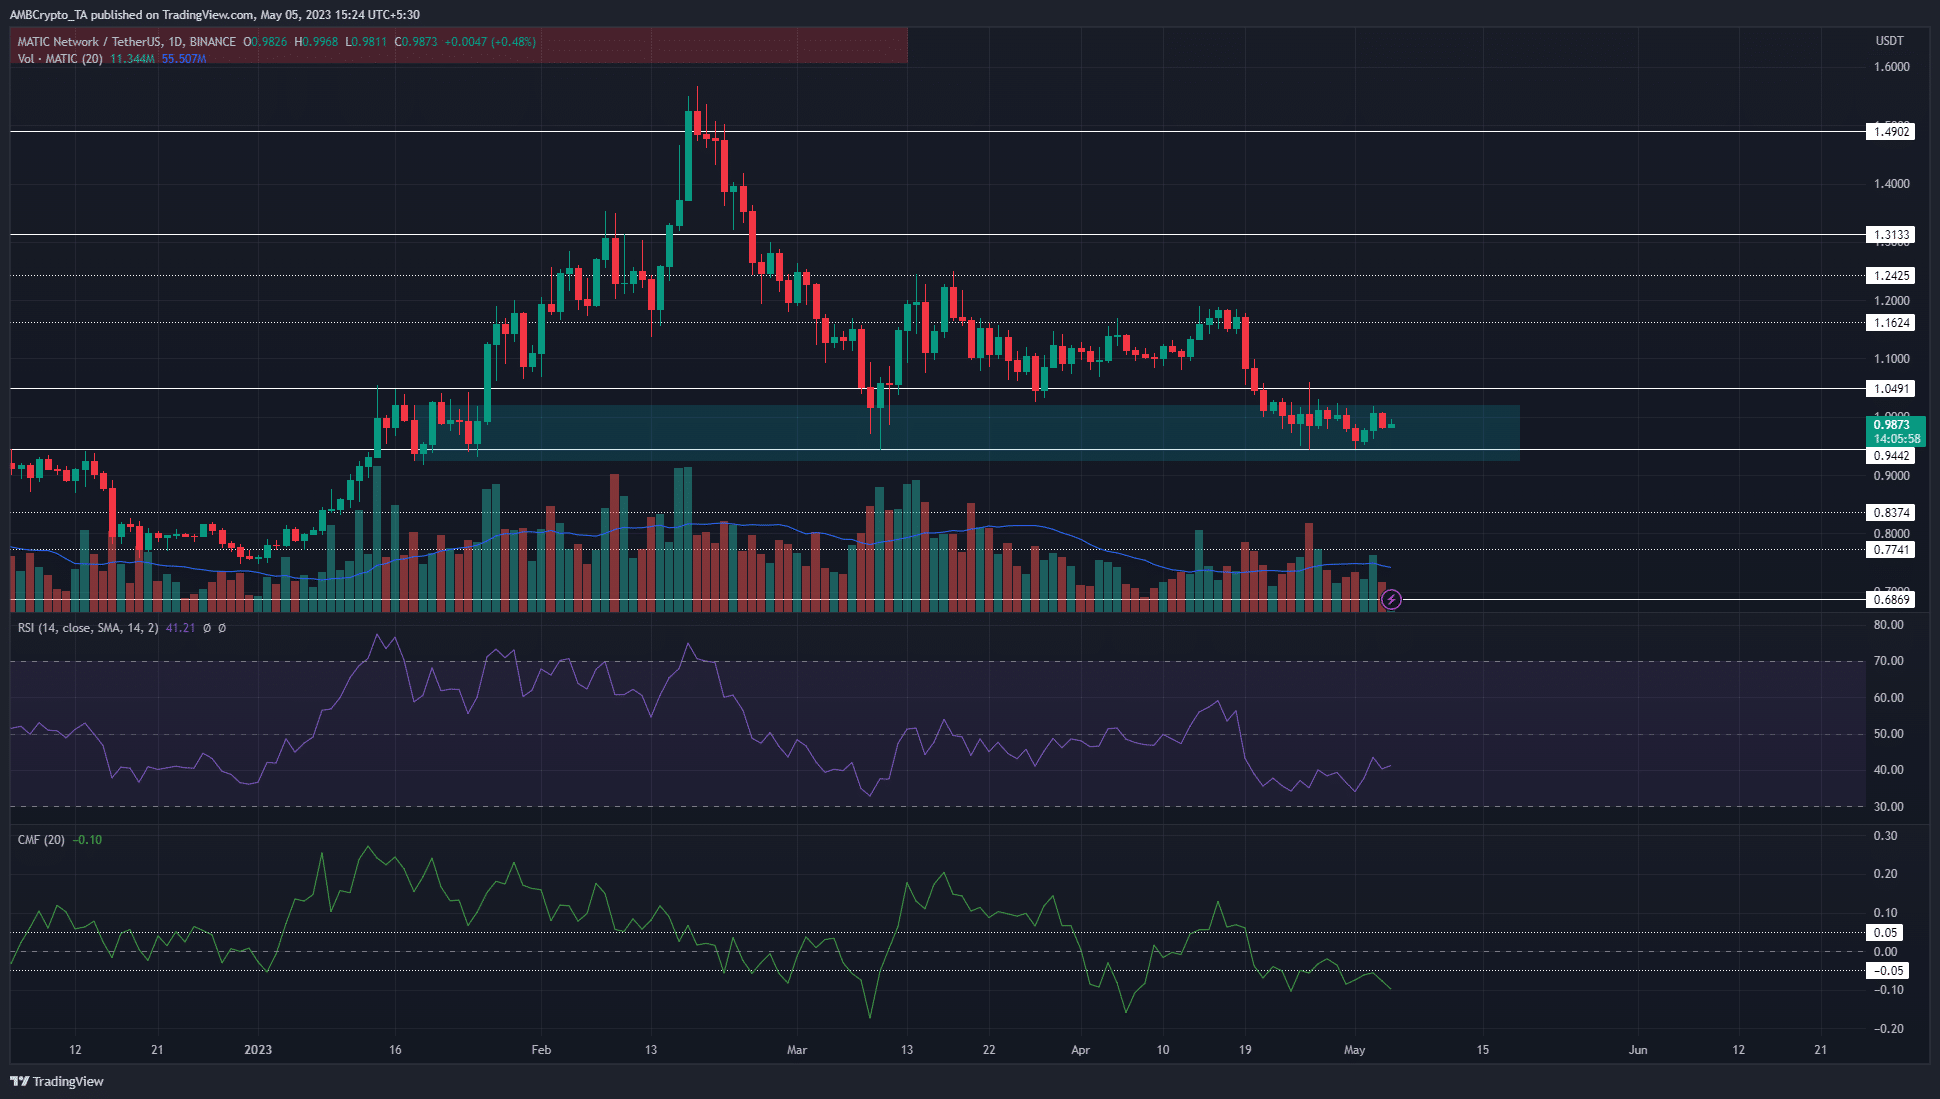
MATIC formed a bullish order block (cyan) on the daily timeframe at the $0.93-$1.02 region on 18 January. At that time, this minor dip was followed by a strong move up to $1.5. In early March, a retest of this demand zone saw MATIC bounce to reach the $1.24 resistance.
Thereafter, the bulls were forced to retreat, but it highlighted the importance of this region on the price charts. It has confluence with the support level at $0.94 as well as the psychologically important $1 level.
In late April, the losses of MATIC were not staunched at $1. The RSI was at 41 to show bearish momentum. The CMF was below -0.05 over the past week as well. This showed strong capital flow out of the Polygon market.
Beneath $0.94, the next support levels to watch out for are $0.837 and $0.77.
How much are 1, 10, or 100 MATIC worth today?
<
Go to Source to See Full Article
Author: Akashnath S
Tip BTC Newswire with Cryptocurrency
Donate Bitcoin to BTC Newswire

Donate Bitcoin Cash to BTC Newswire

Donate Ethereum to BTC Newswire

Donate Litecoin to BTC Newswire

Donate Monero to BTC Newswire

Donate ZCash to BTC Newswire


