Disclaimer: The information presented does not constitute financial, investment, trading, or other types of advice and is solely the writer’s opinion.
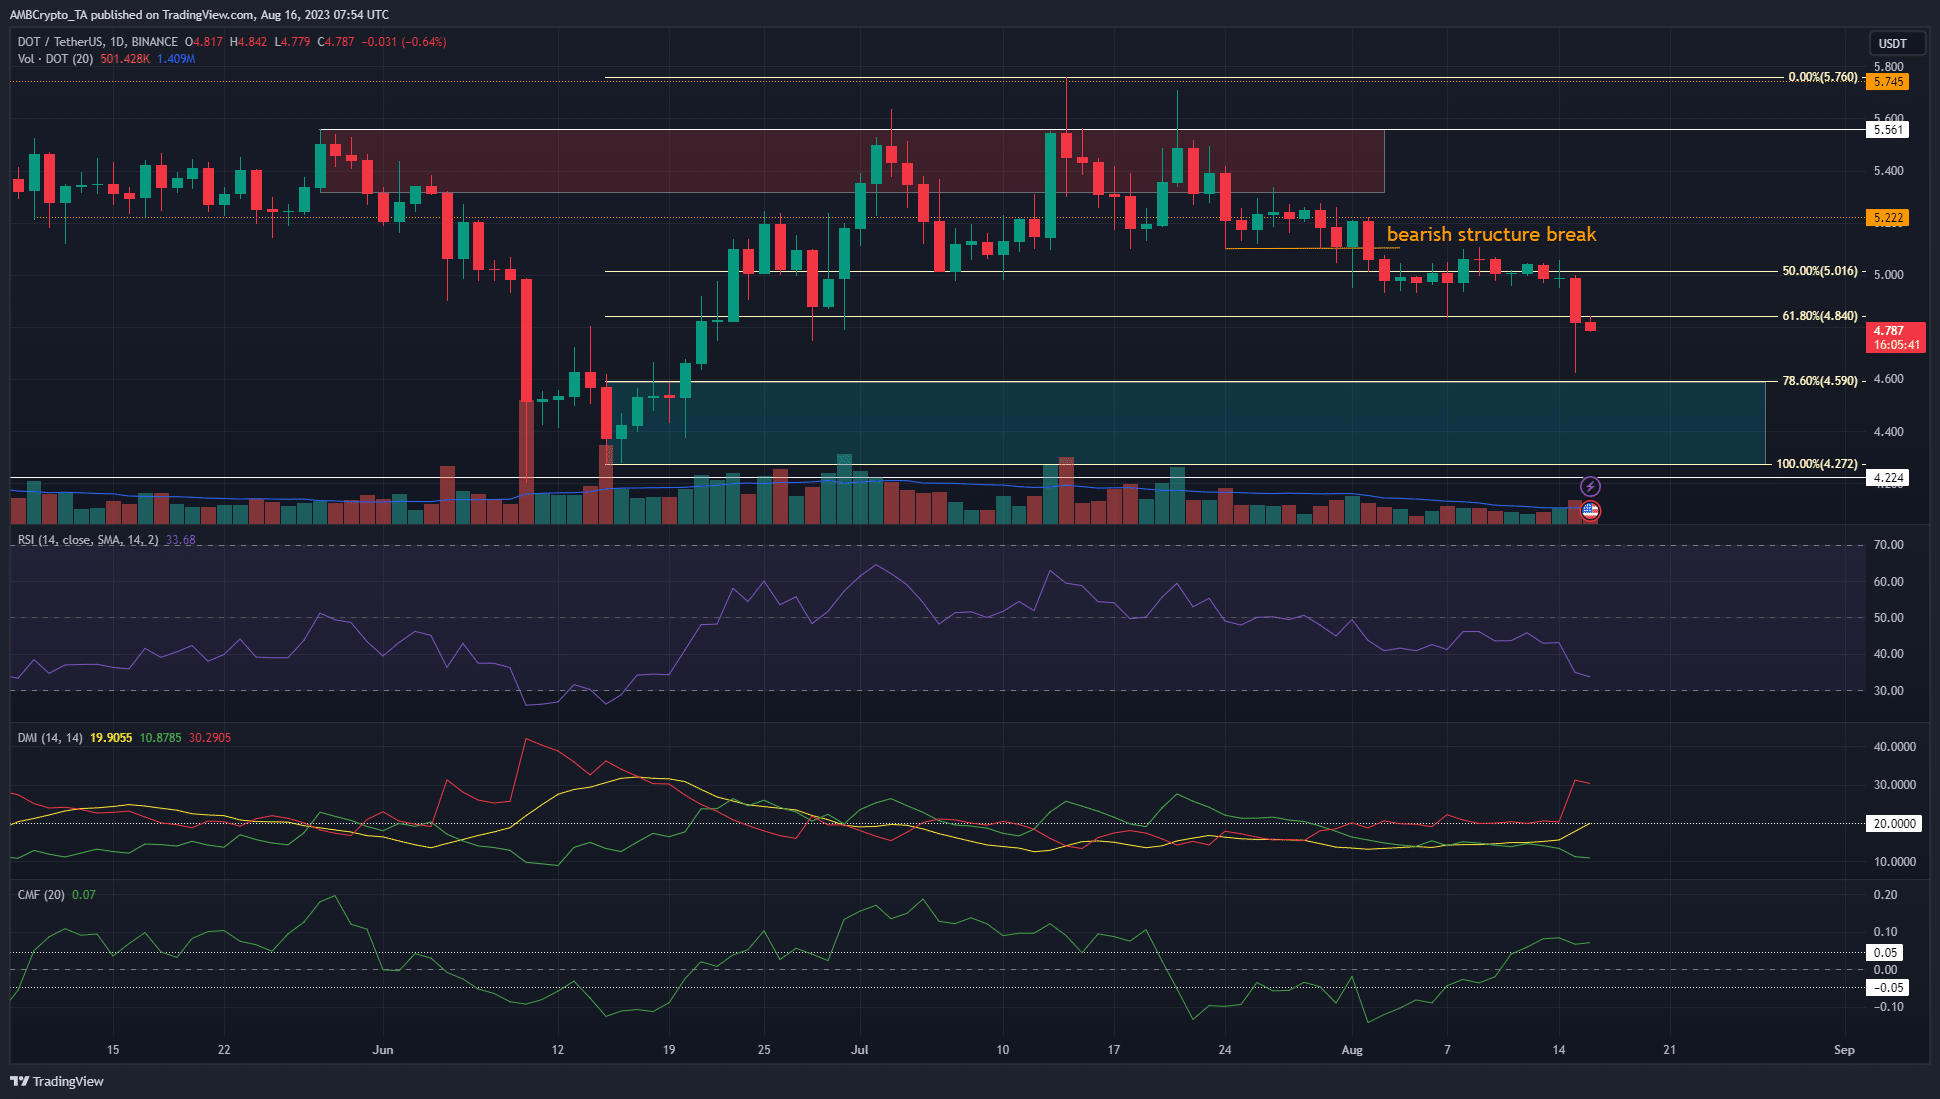
- Polkadot saw its market structure flipped bearish earlier this month.
- A price move to $4.6 was brewing, but any further losses would indicate a drop as far south as $3.9 was on the table.
Polkadot [DOT] saw the bears pull off a convincing move downward after the market structure break in early August. Social metrics and development activity were on the rise but this did nothing to dissuade the sellers.
Is your portfolio green? Check the Polkadot Profit Calculator
The price chart showed that there was a downtrend in progress, and a move toward $4.6 was highly likely. Whether the bulls can defend that level of support or not remains to be seen. The latter development could see DOT drop below the $4 mark.
The attempts to defend $5 over the past two weeks left the buyers exhausted
On 2 August, DOT fell below a recent higher low at $5.1. Marked in orange, this denoted a market structure break in favor of the bears. Thereafter, the price bounced between the $4.95 and $5.06 levels until 15 August.
About 36 hours before press time saw the bears seize the initiative. On the back of a Bitcoin [BTC] rejection at $29.6k, the DOT sellers forced prices to fall as deep as $4.62 on 15 August.
The Directional Movement Index showed a strong bearish trend was close, and the RSI also signaled strong bearish momentum. In contrast, the CMF logged a notable influx of capital into the DOT market.
Fibonacci retracement levels (yellow) were plotted based on the mid-June rally. The 78.6% level at $4.59 was one that bulls must defend. It has confluence with the
Go to Source to See Full Article
Author: Akashnath S
Tip BTC Newswire with Cryptocurrency
Donate Bitcoin to BTC Newswire

Donate Bitcoin Cash to BTC Newswire

Donate Ethereum to BTC Newswire

Donate Litecoin to BTC Newswire

Donate Monero to BTC Newswire

Donate ZCash to BTC Newswire


