Disclaimer: The information presented does not constitute financial, investment, trading, or other types of advice and is solely the writer’s opinion.
- The market structure remained bearish but high volatility was seen in the past four days.
- Despite Polkadot’s bounce to $4.8, indicators pointed toward a lack of buying pressure.
Polkadot’s inability to defend the $5.2 zone from the bears on 5 June was seen as a sign that the market remained strongly bearish. DOT dived much further than the $4.68 support on 10 June, falling as low as $4.2 before bouncing higher.
Read Polkadot’s [DOT] Price Prediction 2023-24
At the time of writing, the bias continued to favor the sellers. The jump to $4.8 on 14 June was followed by a sharp drop to the $4.32 near-term support. In other news, Polkadot users are sure to be excited by the launch of the Polkadot OpenGov.
The possibility of a range formation showed traders what to watch out for
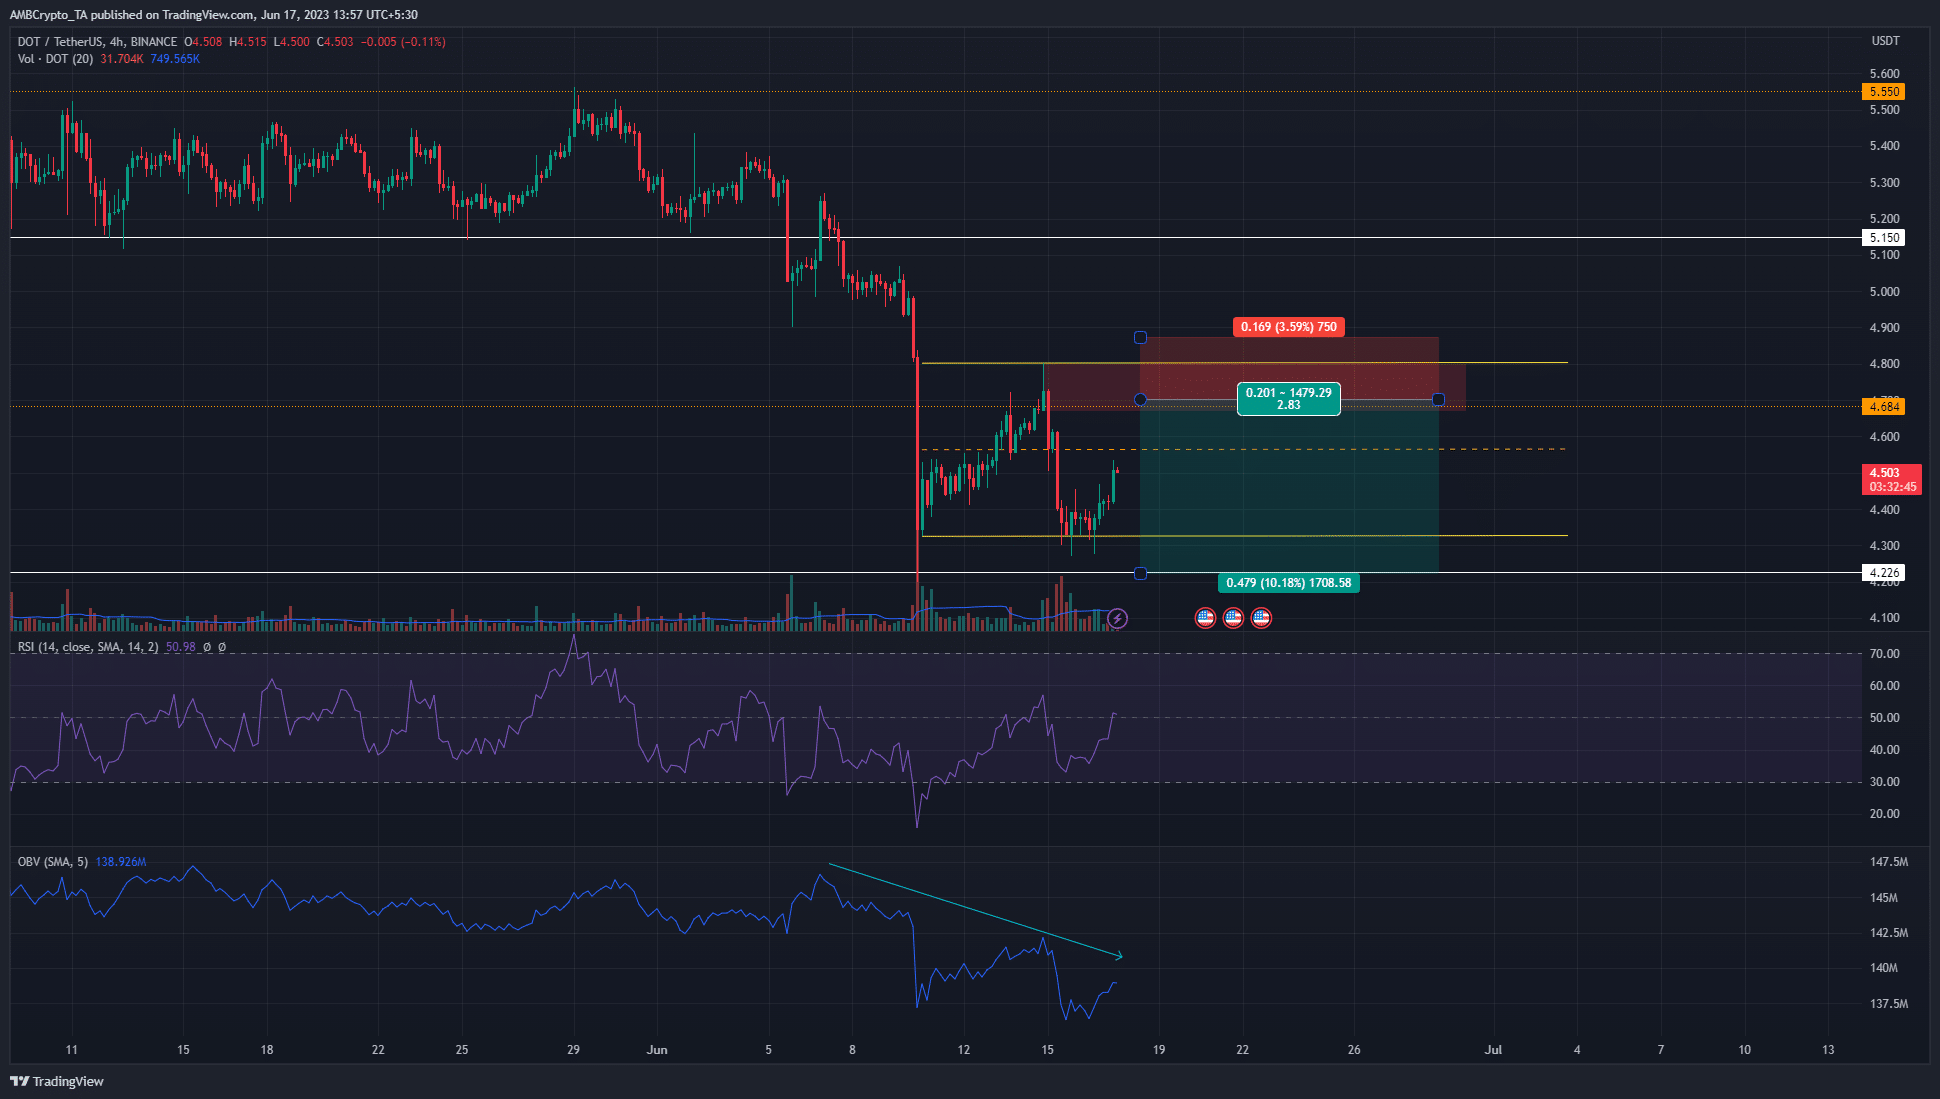
Over the past week, DOT has bounced between the $4.32 and $4.8 levels of support and resistance. Along the way the $4.68 has also been important. Moreover, in the $4.67-$4.8 area we can see a bearish order block on the 4-hour chart as well, highlighted by the red box.
A retest of the bearish OB is likely to be followed by rejection for Polkadot prices. This was because the OBV has been in a downtrend over the past week, reflecting the firm selling pressure.
Combined with the bearish trend that has been dominant since late May, another leg downward appeared likely. Traders can look for a shorting opportunity in the
Go to Source to See Full Article
Author: Akashnath S
Tip BTC Newswire with Cryptocurrency
Donate Bitcoin to BTC Newswire

Donate Bitcoin Cash to BTC Newswire

Donate Ethereum to BTC Newswire

Donate Litecoin to BTC Newswire

Donate Monero to BTC Newswire

Donate ZCash to BTC Newswire


