
Pi coin price is showing signs of an impending crash as it hovers near a potential breakdown zone.
Summary
- Pi coin price is down over 26% since its November high.
- The lack of buyer interest and a looming token unlock are keeping price action capped.
- A bearish double-top pattern has formed on the 4-hour chart.
According to data from crypto.news, Pi Network (PI) was trading at $0.20 on Wednesday, afternoon Asian time, down 26% from its November high and 93.2% from its year-to-date high of $2.99 reached in February.
Pi coin price has been in a strong downtrend as whale buying has continued to diminish, accompanied by a significant drop in trading activity on the Pi network over the past few months. Data from CoinGecko shows that trading volume for the token stood at around $22 million, down from over $2.5 billion seen earlier in February.
Waning whale interest and shrinking volume, when taken together, signal a clear lack of investor confidence, which has most likely led many market participants to rotate away from the token.
Pi coin is also under pressure as more tokens are being unlocked periodically, increasing the circulating supply and diluting existing holdings. Data from Piscan shows that the network is set to unlock nearly 105 million tokens by the end of December and over 1.22 billion tokens throughout 2026.
Such a surge in the amount of circulating tokens, occurring alongside a decline in trading volume and market demand, risks significant dilution. If buying interest remains weak, this imbalance may continue to push prices downwards.
On the 4-hour chart, Pi coin price has dropped below the neckline of a double top pattern that had been forming since late October this year. In technical analysis, this pattern is considered highly bearish and often serves as a precursor to further downside, at least in the short term.
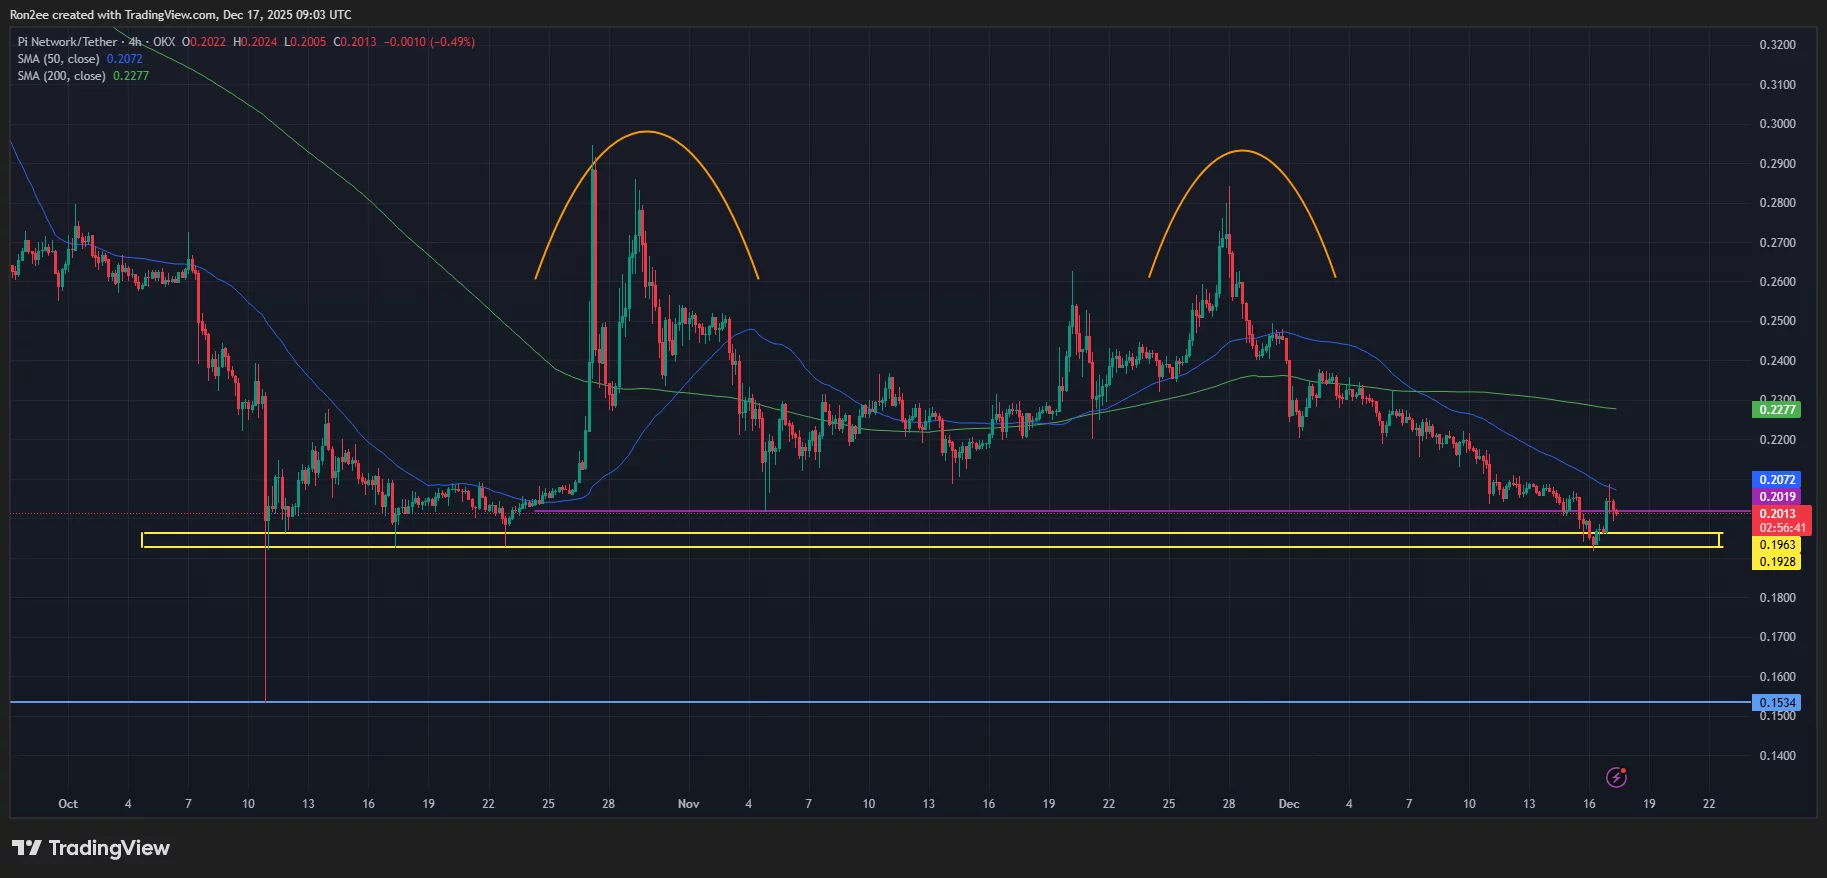
Subsequently, the 50-day simple moving average has crossed below the 200-day one, forming what is known as a death cross on the chart, a telltale sign that bears have largely taken control over the market.
For now, the $0.192-$0.196 levels act as the most important support zone to watch. It has been a key zone where buyers have stepped in multiple times over the past few months to defend against further losses.
If this support fails to hold, it could potentially open doors for a drop towards the $0.15 low, a level last seen during the October selloff. At press time, that level stands roughly 25% below the current price level.
Disclosure: This article does not represent investment advice. The content and materials featured on this page are for educational purposes only.
Go to Source to See Full Article
Author: Rony Roy