- PEPE has tested resistance at the 200-day SMA as bullish signs emerge.
- Large PEPE transactions have also increased from 1.96 trillion to 7.71 trillion.
PEPE [PEPE] traded at $0.00000947 at press time after a 5.6% gain in 24 hours. The recent gains come amid a bullish trend across the broader cryptocurrency market. Despite these gains, PEPE remains down by around 7% in the last seven days.
Several bullish signs have formed around PEPE on the one-day chart suggesting that the meme coin could be poised for another rally.
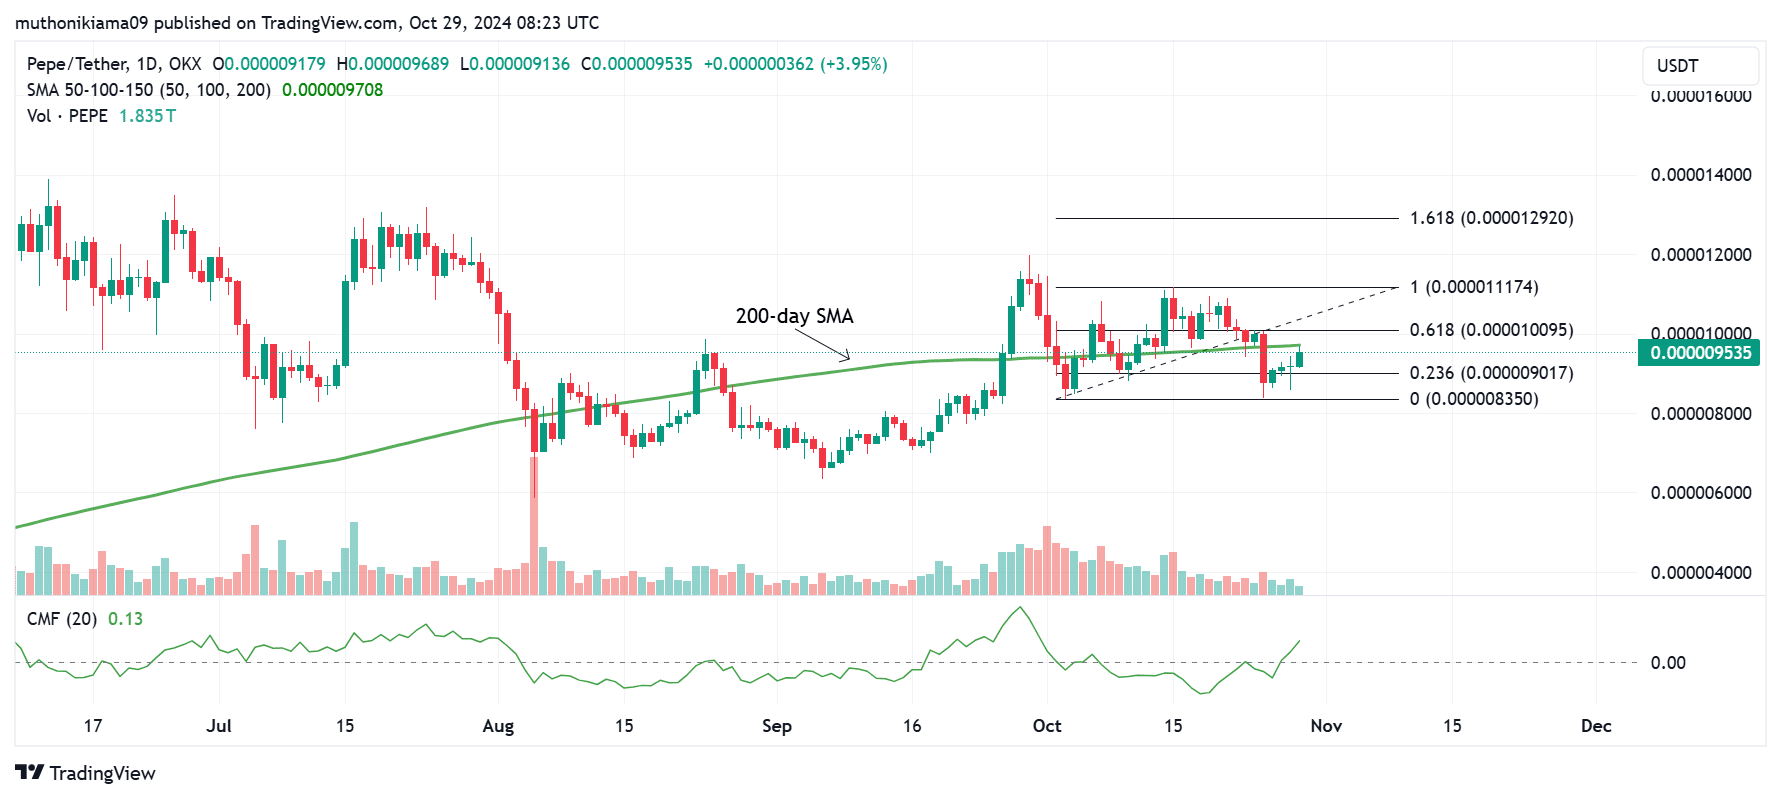
PEPE has been trading below the 200-day Simple Moving Average (SMA) on the one-day chart since mid-October, indicating a long-term downtrend. However, a reversal could be on the way after the price tested resistance at this level.
If it flips this resistance, it could strengthen the uptrend as it will confirm that the momentum has shifted to bullish.
Source: Tradingview
The Chaikin Money Flow (CMF) shows that buying pressure is rising while the selling pressure is waning.
At press time, the CMF had a positive value of 0.18 suggesting rising interest in the meme coin. The green volume histogram bars further show that buyers have been more than sellers in the last four days.
If these bullish trends continue, and PEPE flips resistance at $0.0000097, it could stir a 36% rally to the 1.618 Fibonacci level (0.0000129).
PEPE whale transactions surge
Data from IntoTheBlock shows a significant increase in large PEPE transactions. These transactions increased from 1.96 trillion, valued at around $17M, to 7.71 trillion, valued at $70M, in 24 hours.