Key Takeaways
What do the TD Sequential buy signals on PEPE indicate?
The back-to-back TD Sequential buy signals suggest the downtrend may be weakening, highlighting a potential short-term trend reversal.
How do exchange outflows and the NVT ratio affect PEPE’s outlook?
Outflows reduce immediate selling pressure and support upside momentum, but the elevated NVT ratio warns of potential overvaluation and short-term caution.
The TD Sequential indicator has flashed two consecutive buy signals on Pepe’s [PEPE] daily chart, pointing to possible exhaustion in the ongoing downtrend.
This indicator is widely used to identify areas where momentum may shift, especially when selling pressure shows signs of weakening.
A double confirmation strengthens the bullish case, as back-to-back signals are relatively rare. While this setup does not guarantee immediate price action, it does highlight an increased likelihood of trend reversal.
Traders will now monitor whether PEPE can sustain this signal with stronger participation from buyers.
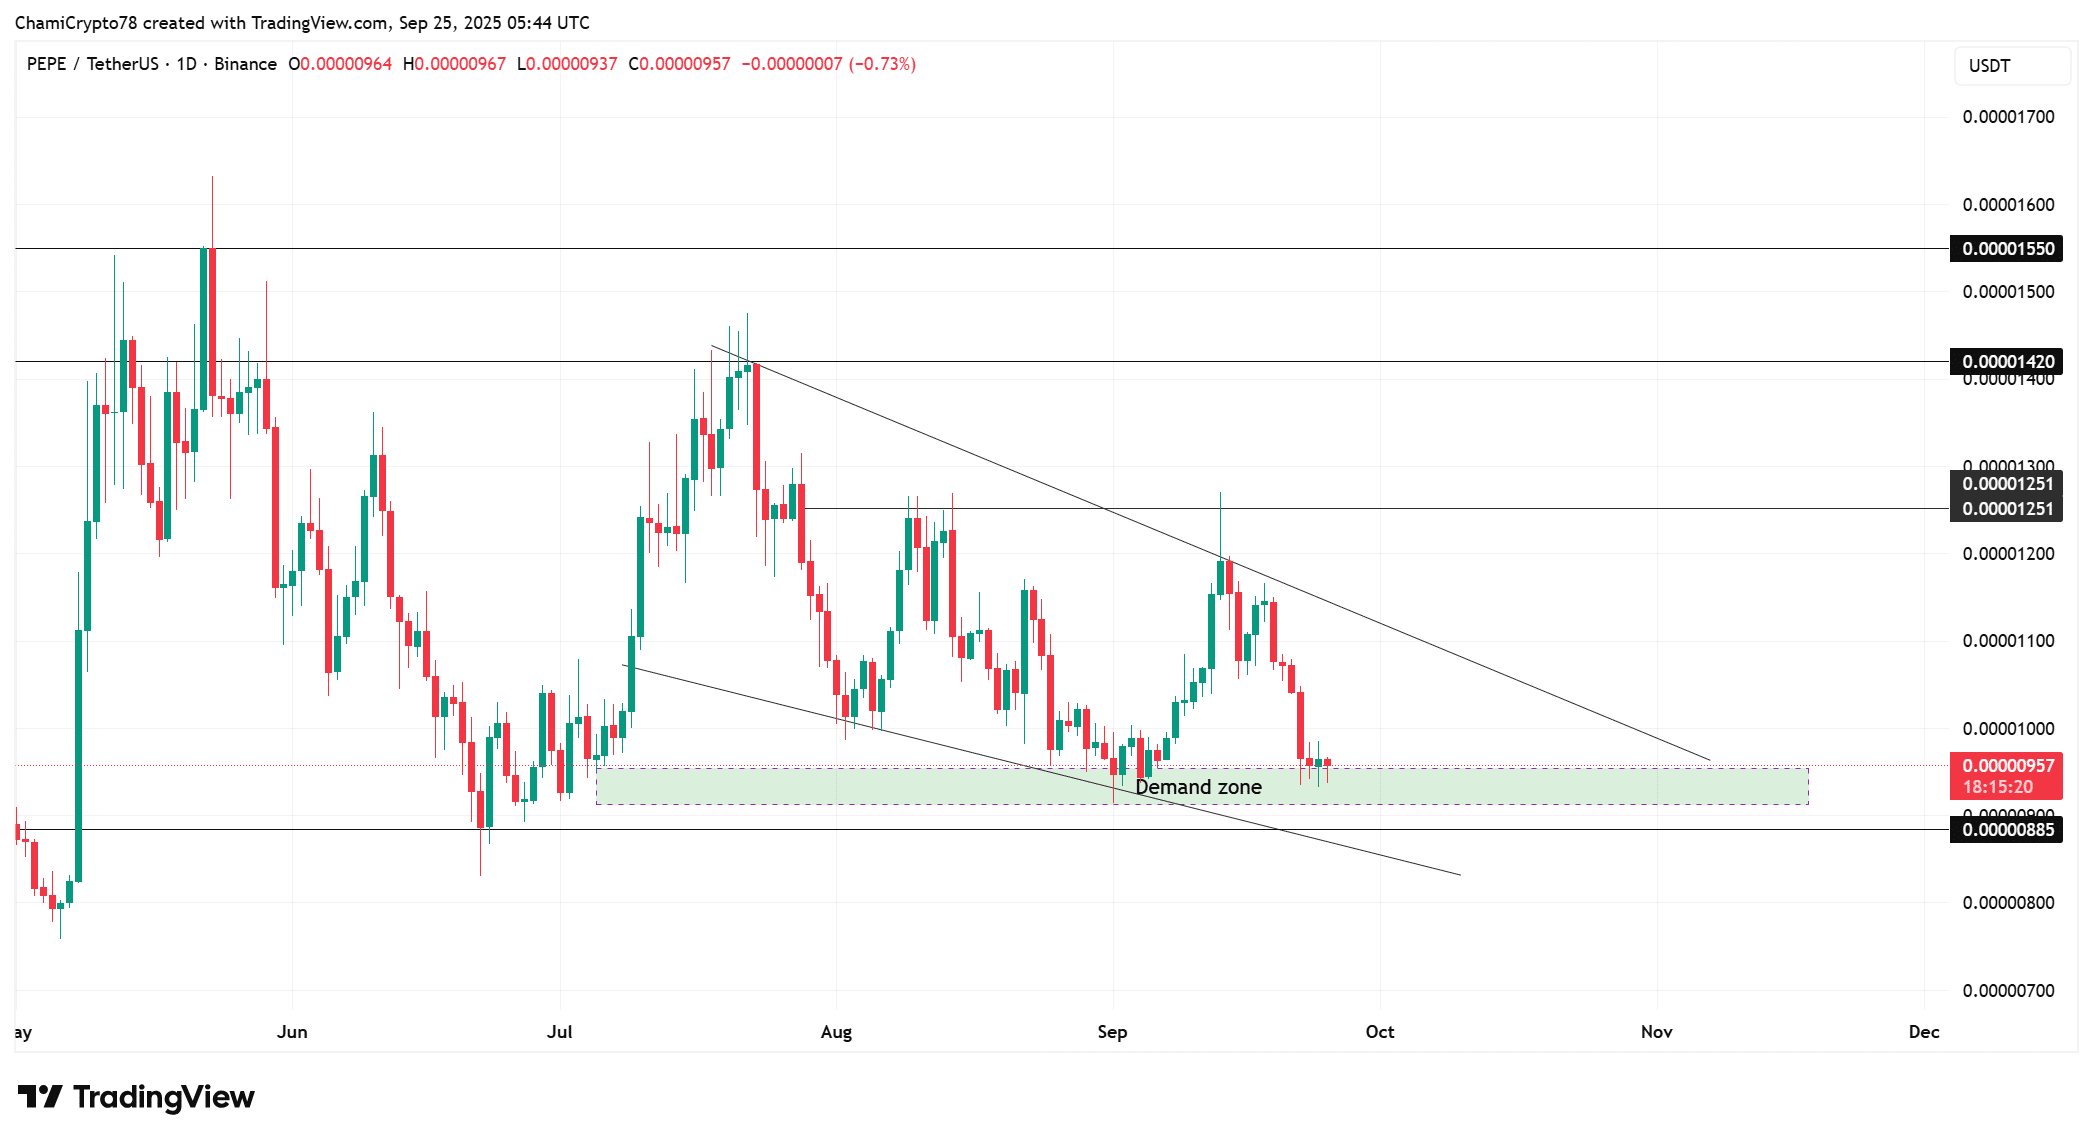
Price tests the demand zone
At the same time, the token is consolidating close to its highlighted demand zone, which has historically acted as a reliable base.
However, the structure still leaves room for price to touch the lower boundary of the wedge, testing support around $0.00000885 before any significant rebound occurs.
Should this support hold, upside targets remain at $0.00001251, $0.00001420, and $0.00001550. Failure to maintain the zone could trigger further downside volatility in the short term.