Disclaimer: The information presented does not constitute financial, investment, trading, or other types of advice and is solely the writer’s opinion.
- The H4 bearish breaker would likely offer intense resistance upon a retest.
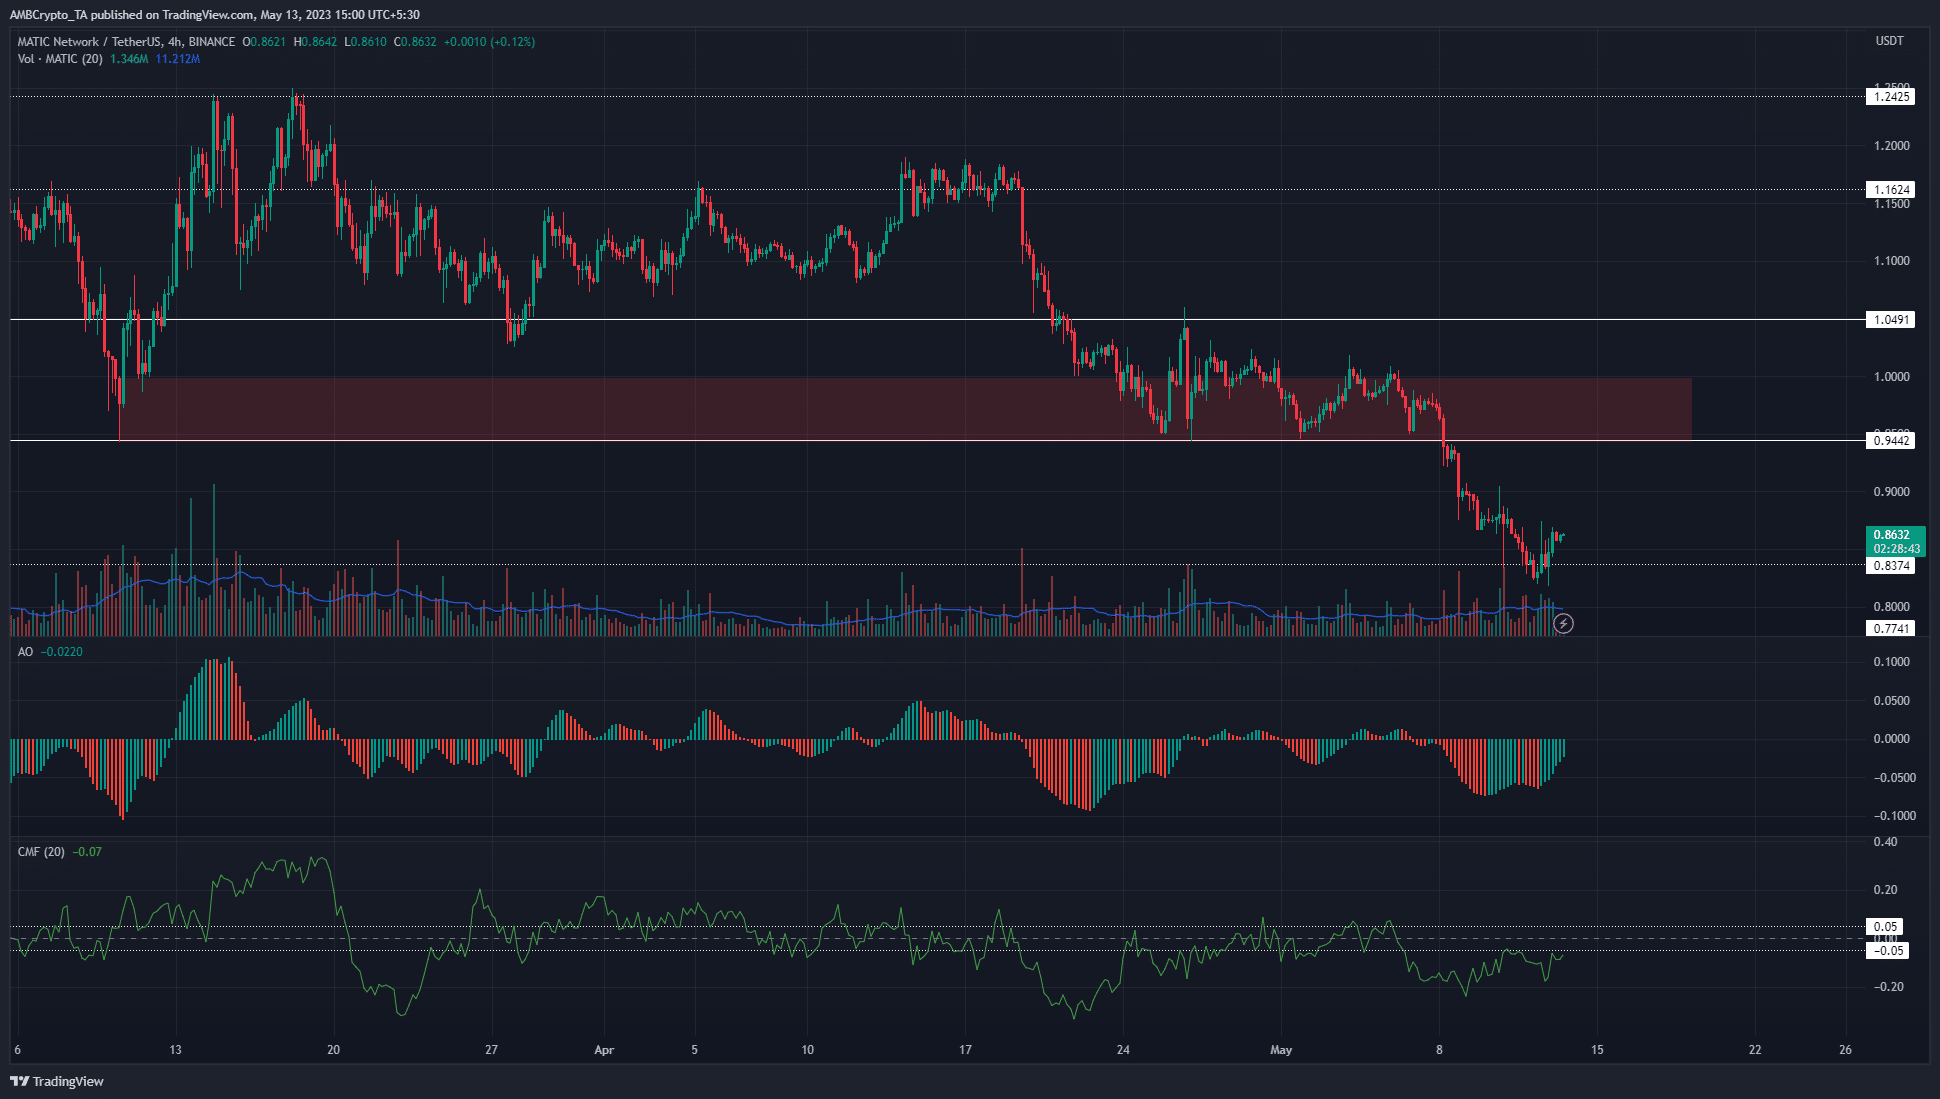
- The FVG in the $0.92 area was also something to watch out for.
MATIC saw another leg down on the price charts after the bulls’ failure to defend the critical support at $0.95. This zone had a confluence of technical and longer-term horizontal levels of support but the bears were too strong.
Is your portfolio green? Check the Polygon Profit Calculator
With Bitcoin beneath the $27.8k mark as well, it was likely that more losses could follow after a minor bounce in prices over the weekend. MATIC saw some respite at the $0.82 support over the past 24 hours.
A breaker block just above an imbalance meant bulls were at a steep disadvantage
The charts above highlighted the former bullish order block at the $0.94-$1 area in red. This area acted as a support zone in late April, but the bulls eventually succumbed. Hence, the bullish OB was flipped to a bearish breaker.
Moreover, the charts showed the presence of a fairly large imbalance created on 8 May. This FVG stretched from $0.9 to $0.93, and could attract MATIC to it before sending prices lower.
Combined with the breaker block above, it was highly likely that MATIC bulls would be unable to drive prices back above $1 unless the sentiment shifted dramatically.
The Awesome Oscillator showed bearish momentum was weakening, and was a result of the bounce from $0.82. Meanwhile the CMF remained below -0.05 to show strong capital flow out of the market.
Sentiment leaned heavily in bearish favor but began to shift in recent
Go to Source to See Full Article
Author: Akashnath S
Did you like this?
Tip BTC Newswire with Cryptocurrency
Donate Bitcoin to BTC Newswire
 Scan the QR code or copy the address below into your wallet to send some bitcoin:
Donate Bitcoin Cash to BTC Newswire
Scan the QR code or copy the address below into your wallet to send bitcoin:
Donate Ethereum to BTC Newswire
Scan the QR code or copy the address below into your wallet to send some Ether:
Donate Litecoin to BTC Newswire
Scan the QR code or copy the address below into your wallet to send some Litecoin:
Donate Monero to BTC Newswire
Scan the QR code or copy the address below into your wallet to send some Monero:
Donate ZCash to BTC Newswire
Scan the QR code or copy the address below into your wallet to send some ZCash:
Tip BTC Newswire with Cryptocurrency
Donate Bitcoin to BTC Newswire

Donate Bitcoin Cash to BTC Newswire

Donate Ethereum to BTC Newswire

Donate Litecoin to BTC Newswire

Donate Monero to BTC Newswire

Donate ZCash to BTC Newswire


