- DOT has surged by 6.36% on weekly charts.
- An analyst eyed a historical surge, citing Fantom’s historical pattern.
After a sustained decline, Polkadot [DOT] has made a strong back over the past week. Since hitting a low of $3.9, DOT has seen a strong upsurge, hiking by 12.82%.
Equally, the altcoin has flipped SMA on daily charts, indicating a strong upward momentum.
At the time of writing, DOT was trading at $4.37. This marked a 3.63% increase over the past day, with an extension to this bullish trend by 6.36% on weekly charts.
Prior to this, DOT had been on a downward trajectory declining by 2.12% on monthly charts.
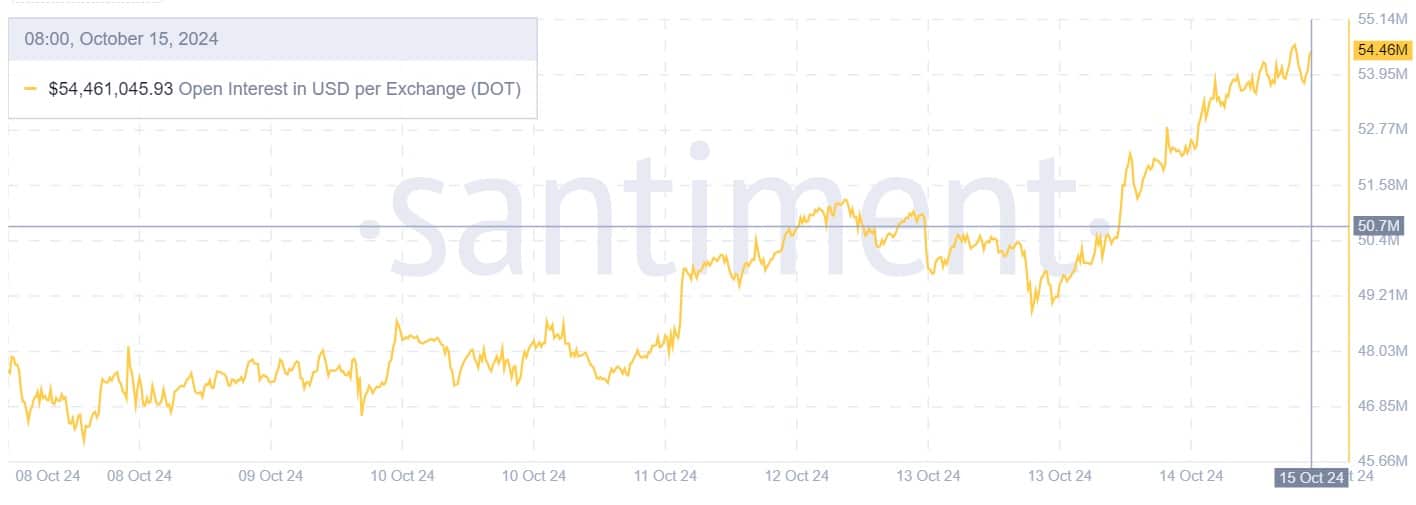
However, the markets have shown strength over the past day with increased demand for the altcoin. Thus, DOT’s trading volume has surged by 12.30% to $133.93 million. Also, its market cap increased by 3.78% over this period.
As expected, these recent market conditions have rejuvenated the crypto community. Inasmuch, popular crypto analyst Ali Martinez has suggested Polkadot is ready to rally, citing Fantom’s historical pattern.
Market sentiment
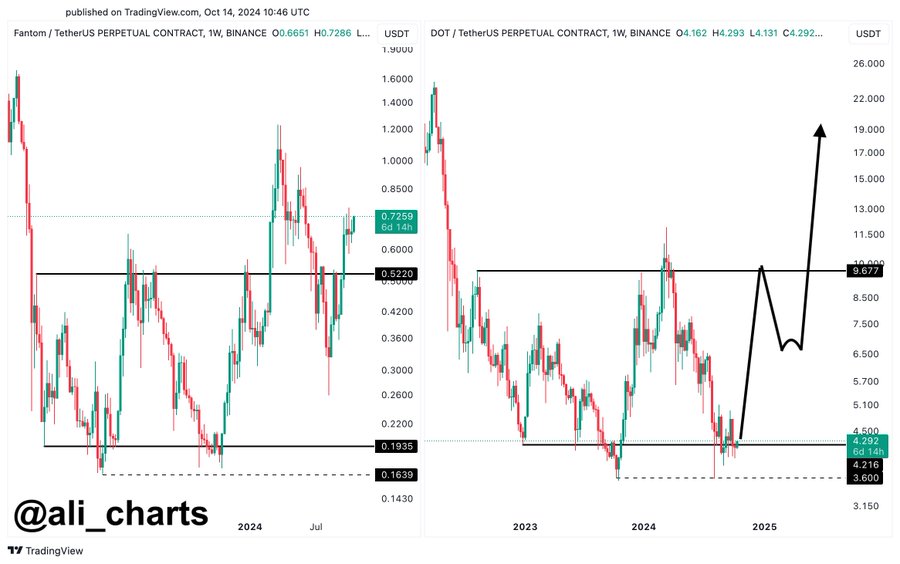
In his analysis, Martinez posited that DOT could be following Fantom’s footsteps.
Source: X
According to him, if the current pattern holds, DOT could rise to $9.7, retrace to $6.7 and then rally to a year high of $20.
In context, Fantom experienced an exponential surge based on this pattern hiking by 192.31% from a local low of $0.26 to $0.76.
Therefore, based on this analogy, DOT could surge by 357.67% holding the pattern constant.
What DOT charts says
As observed by Martinez, Polkadot is experiencing favorable market sentiment that could the altcoin for an exponential surge.