Disclaimer: The information presented does not constitute financial, investment, trading, or other types of advice and is solely the writer’s opinion.
- Litecoin did not show signs of a bounce in prices yet, even on the lower timeframes
- The imbalance to the north would present a good risk-to-reward short-selling opportunity for LTC traders
Litecoin [LTC] saw an increase in accumulation on-chain. Yet, the price chart showed that there was a downtrend in progress on the higher timeframe. After the halving, the price fell past multiple support levels.
Read Litecoin’s [LTC] Price Prediction 2023-24
The inability of the buyers to defend these demand zones signaled bears were dominant. Over the coming week, it was likely that further losses could ensue for Litecoin. Where can traders look to enter positions?
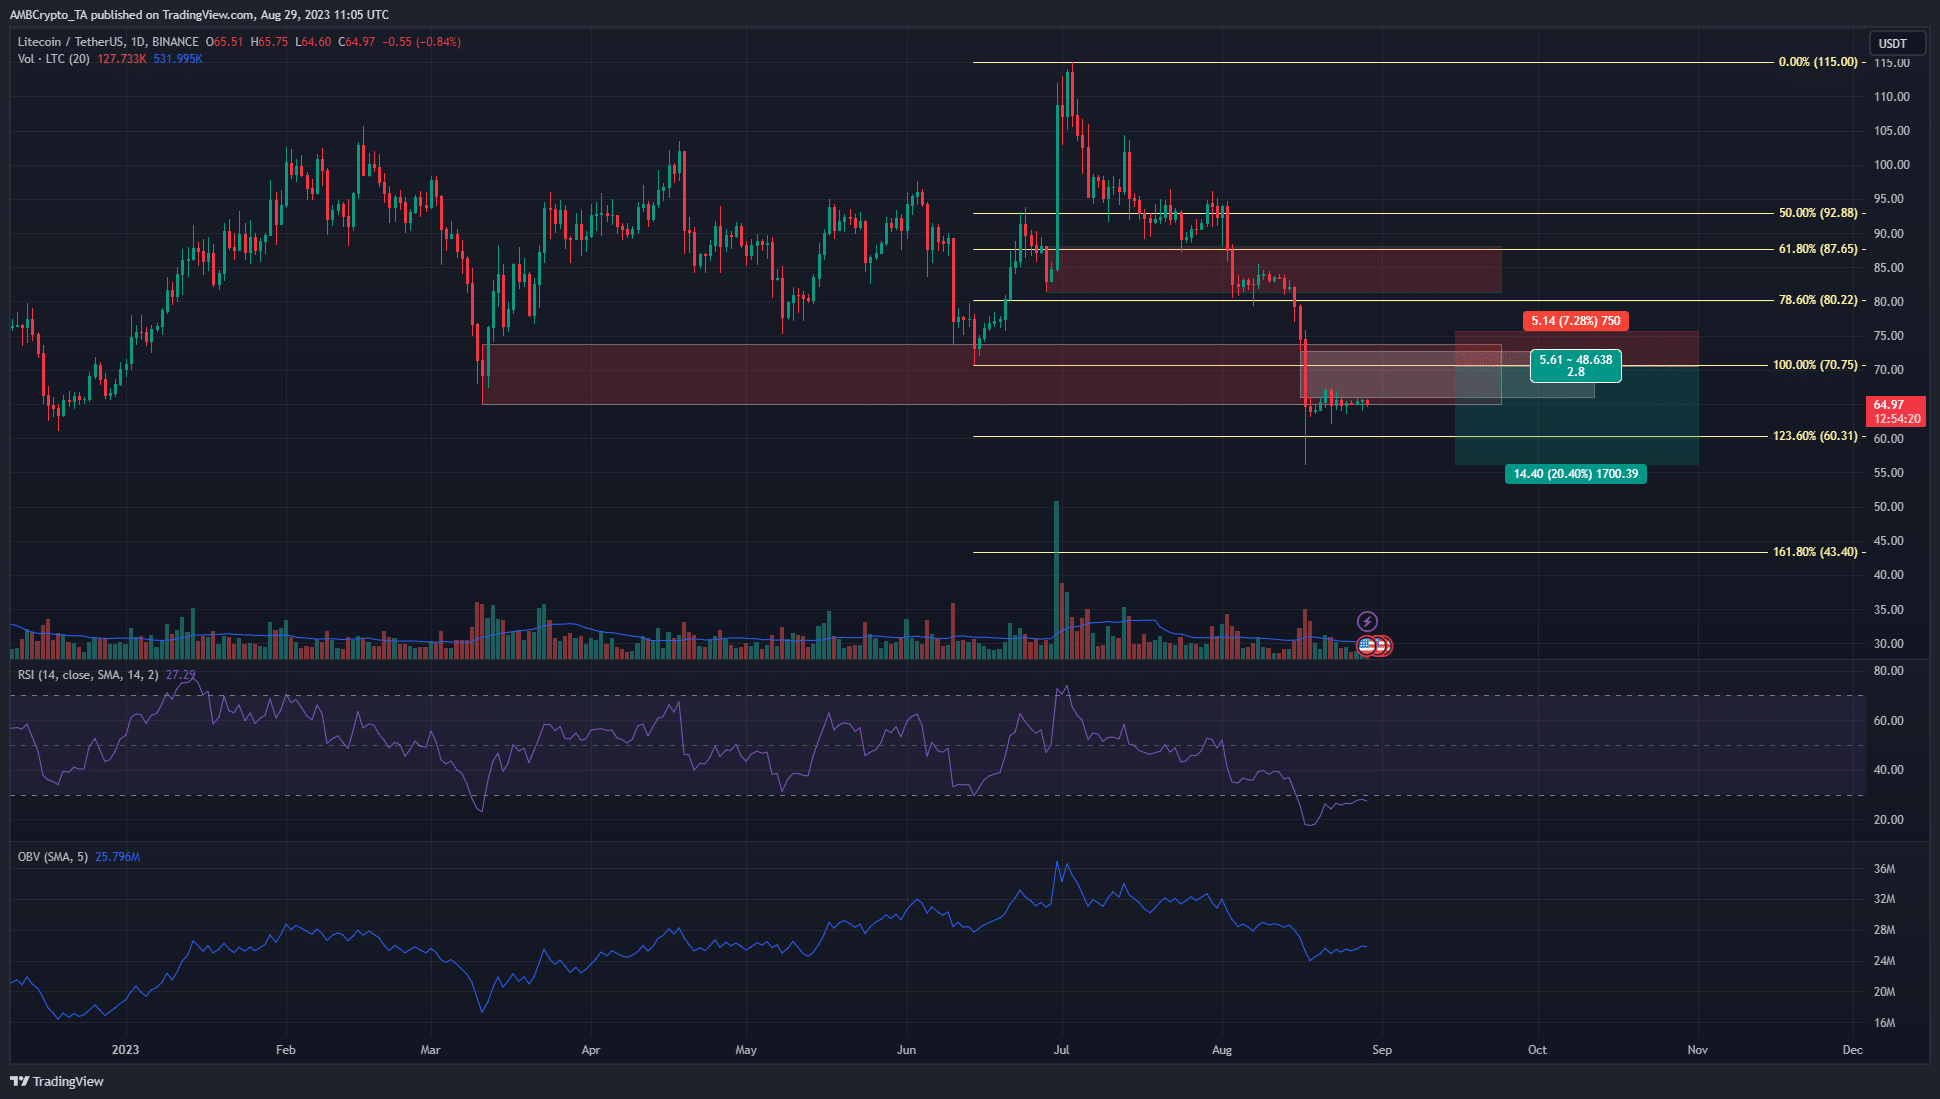
Litecoin showed an imbalance at $70 that could be retested before rejection
A set of Fibonacci retracement levels (pale yellow) were plotted based on the rally from $70.75 to $115. LTC was already beneath the lows from that rally. The market structure was bearish on the daily timeframe.
Moreover, there was a fair value gap around the $70 area highlighted in white. LTC witnessed a downward move that began on 8 August. It went from $85.47 to $56, and the 50% mark for this move stood at $70.74. This coincided with the low from 14 June that made the bearish breaker block from mid-June.
Hence, a bounce toward the $70.75 level was a possibility in the coming days. It would partially fill the imbalance and also retest the 50% level of the previous drop. The OBV did not support the idea of such a bounce as it has been in a firm downtrend since July.
The RSI was also belo
Go to Source to See Full Article
Author: Akashnath S
Tip BTC Newswire with Cryptocurrency
Donate Bitcoin to BTC Newswire

Donate Bitcoin Cash to BTC Newswire

Donate Ethereum to BTC Newswire

Donate Litecoin to BTC Newswire

Donate Monero to BTC Newswire

Donate ZCash to BTC Newswire


