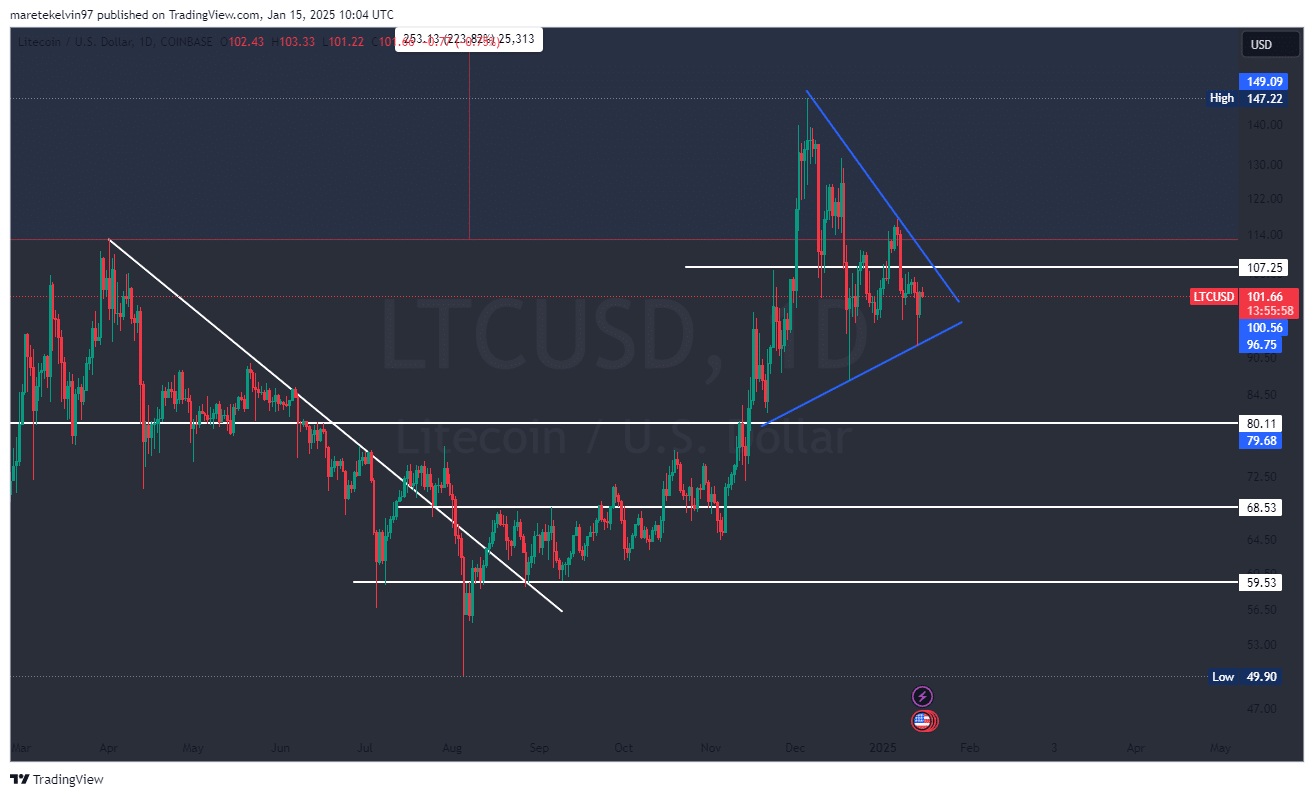
- LTC prices were consolidating within a symmetrical triangle.
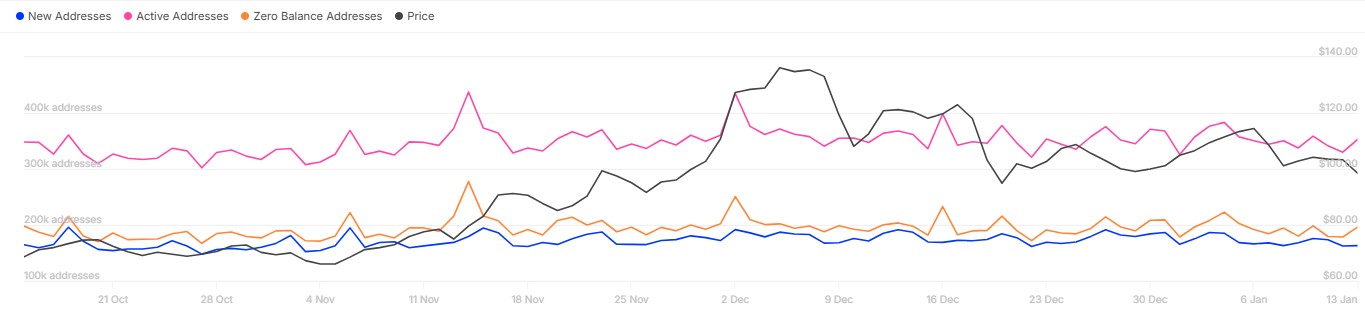
- Metrics showed heightened activity, with large transactions hinting a surging whale activity.
Litecoin [LTC] prices have been consolidating within a symmetrical triangle pattern since mid-November as seen on the daily chart, indicating a sign of market indecision.
This pattern often precedes significant price movements as buyers and sellers battle for dominance. At the time of writing, LTC was trading at $101, a 10% surge since its recent rebound from the key triangle support level in the last 48 hours.
Interestingly, this consolidation comes at a time when the market is awaiting a clear signal. A breakout could be imminent, but its direction depends on the volume and overall market sentiment.
Continued bullish momentum might push LTC beyond the critical triangle resistance, while bearish pressure could lead the altcoin to drop further.
LTC active addresses paint a bullish picture
Digging deeper into on-chain metrics, Litecoin’s network is showing strong engagement. IntoTheBlock on-chain data highlights that the altcoin’s network is still buzzing. The number of active addresses surged recently by around 7%, suggesting continued LTC user activity.
Besides the active addresses, the recent surge in the altcoin’s new wallet creations adds to the bullish outlook. Increased adoption typically occurs with strong trading activity that could magnify any breakout.
Go to Source to See Full Article
Author: Kelvin Murithi