Disclaimer: The information presented does not constitute financial, investment, trading, or other types of advice and is solely the writer’s opinion.
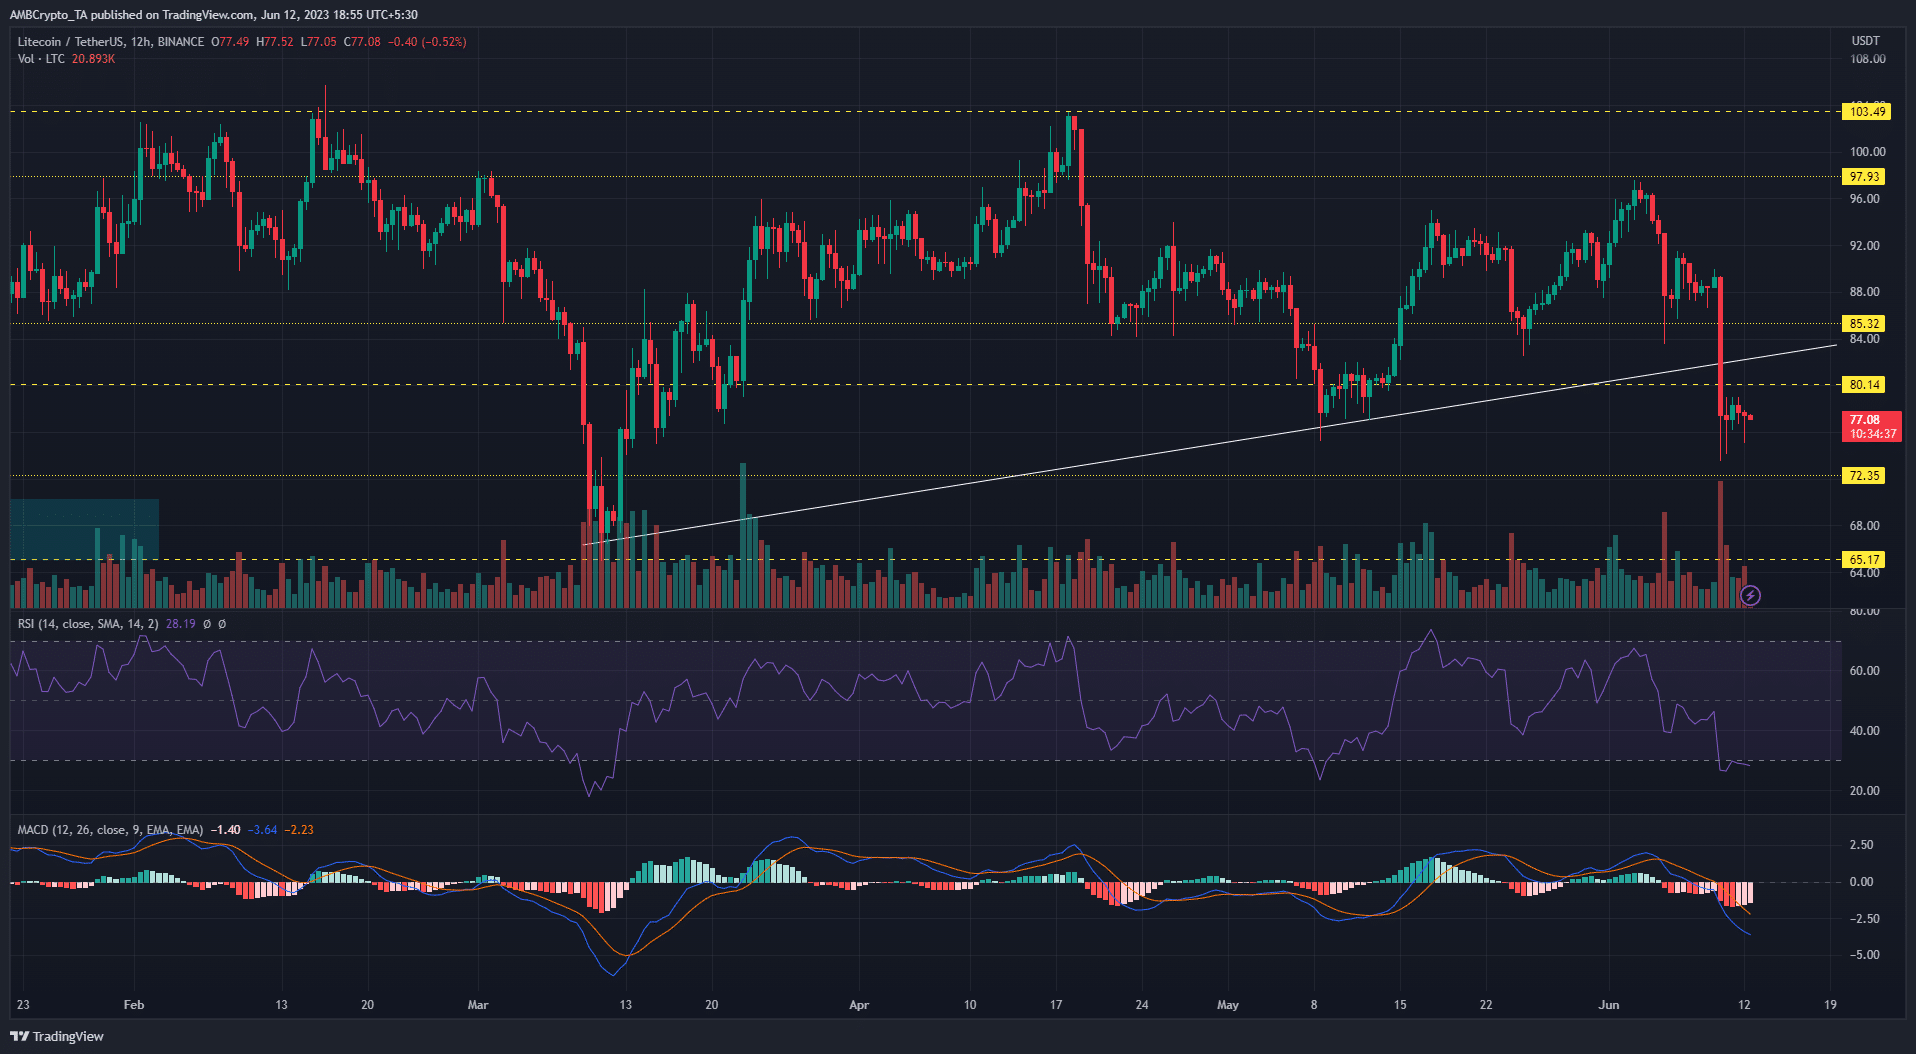
- Bears halted bullish momentum with a break of key trendline support.
- Shorts held a 51.4% advantage on the long/short ratio.
Litecoin’s [LTC] month-long bullish streak was halted by bears over the past 48 hours with a break of the trendline support. This saw LTC close under the $80 psychological level with price trading at $77, as of press time.
Read Litecoin’s [LTC] Price Prediction 2023-24
With Bitcoin [BTC] ranging between the $25.6k and $26.2k levels, LTC could experience further downside in the coming days.
Price rejection at $97 resistance level ushered intense selling wave
Examining Litecoin’s price action in the 12-hour timeframe revealed an interesting price war between bulls and bears. Bulls held the upper hand from 14 May using the $80 psychological level to rally. The significant buying pressure saw bulls claim the minor resistance at $85 with successive bullish candles.
However, the $97 resistance level proved to be a major stumbling block. Price was swiftly rejected at the level with bears immediately seizing control. Three bearish candles in a row saw the price quickly drop to the $85 support level. A brief bullish rebound from the $85 support level was again curtailed by bears. Sustained selling pressure on 10 June saw bears claim the $85 and $80 support levels, breaking the lower high of the bullish uptrend and smashing the support confluence at $80.
The on-chart indicators highlighted the bearish dominance. The Relative Strength Index (RSI) dropped into the oversold zone and stood at 2
Go to Source to See Full Article
Author: Suzuki Shillsalot
Tip BTC Newswire with Cryptocurrency
Donate Bitcoin to BTC Newswire

Donate Bitcoin Cash to BTC Newswire

Donate Ethereum to BTC Newswire

Donate Litecoin to BTC Newswire

Donate Monero to BTC Newswire

Donate ZCash to BTC Newswire


