Disclaimer: The information presented does not constitute financial, investment, trading, or other types of advice and is solely the writer’s opinion
- LTC formed an inverse head and shoulders pattern.
- Addresses with more than $10k increased.
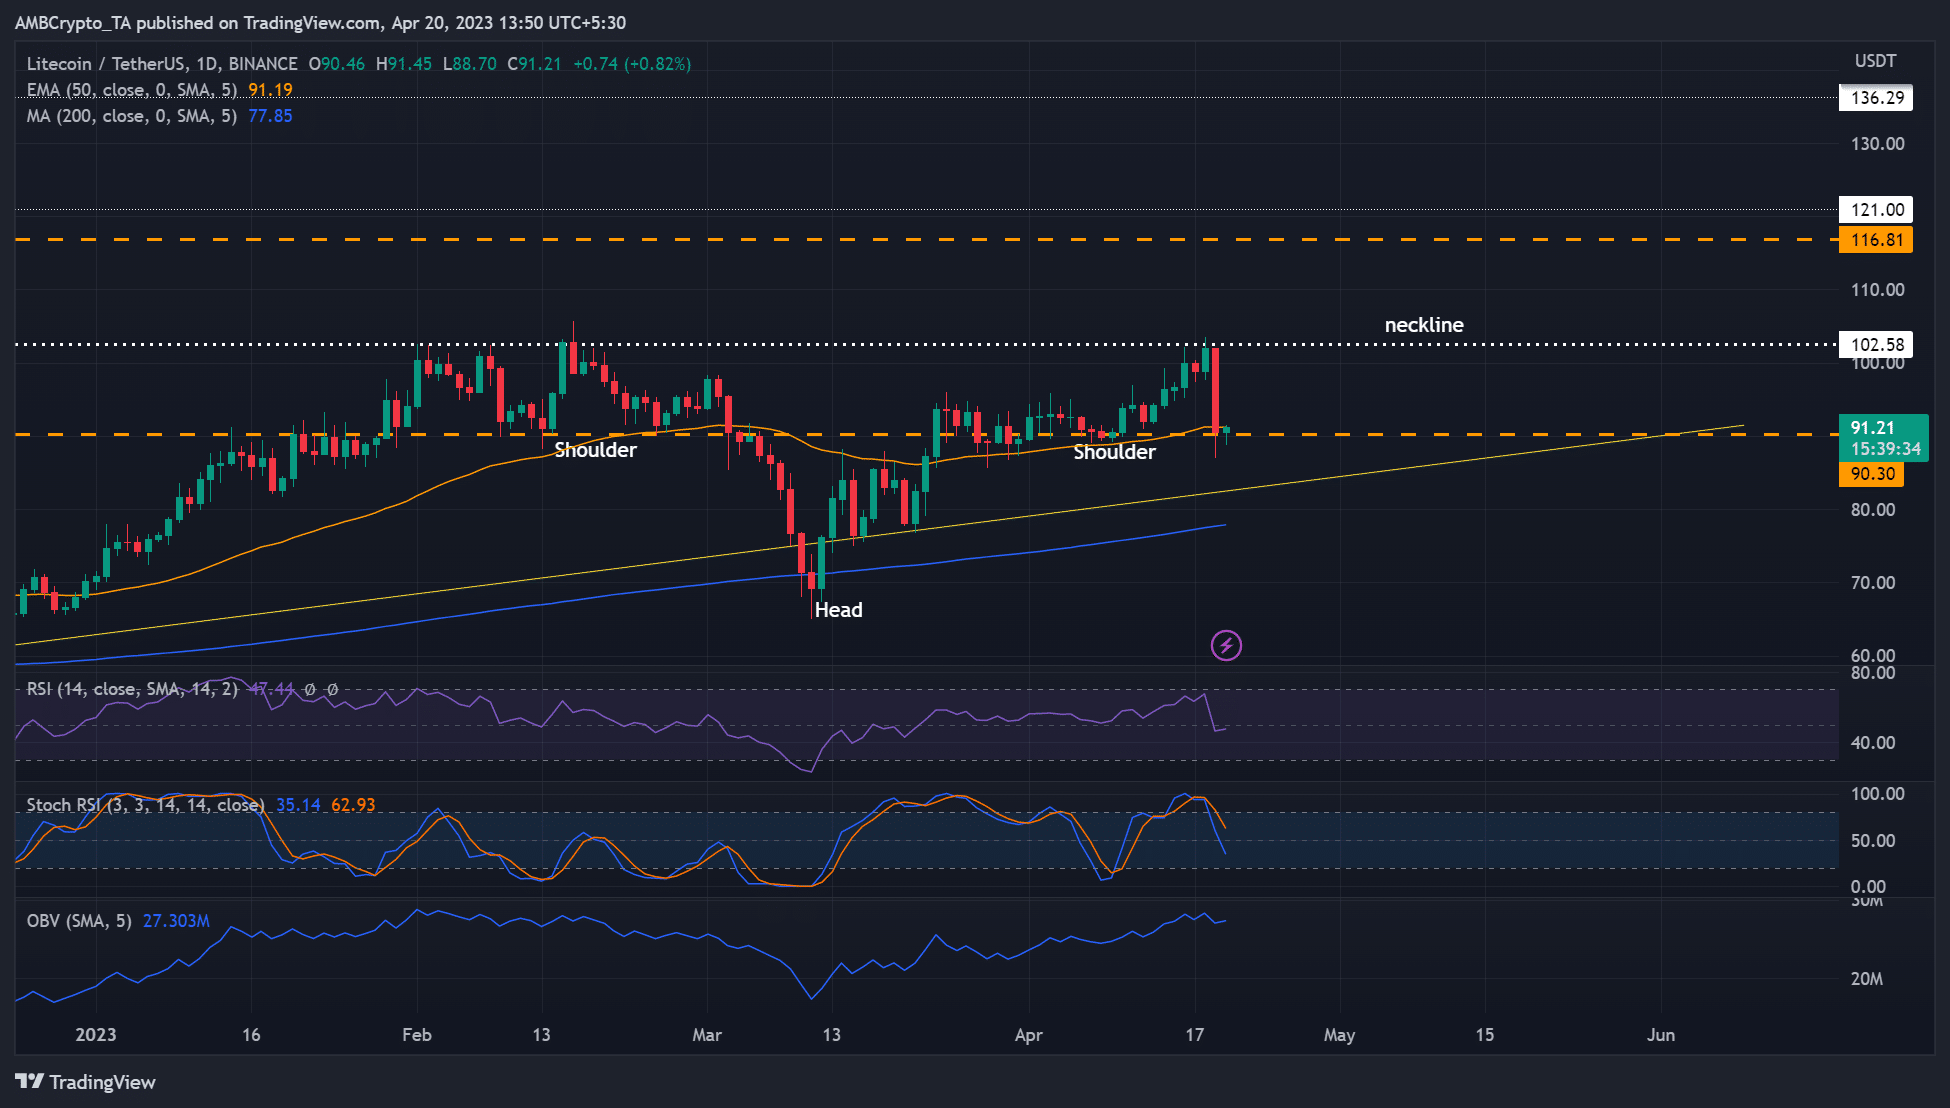
After a strong rally in January, Litecoin’s [LTC] price action made consistent lows and highs, chalking an inverse head and shoulders pattern.
Notably, the stiff resistance and neckline of $102.58 have rejected the price a few times. However, a break above the neckline could tip bulls for more gains.
Read Litecoin [LTC] Price Prediction 2023-24
Meanwhile, U.S. investors are currently glued on earnings season as they track Q1 earnings and results. Notably, the U.S. Flash Services PMI (Purchasing Managers Index) data will also be released on 20 April 2023.
Collectively, the earning season and the PMI data can affect U.S. stock markets, USD pairs and could spill to USDT pairs, too, LTC/USDT included. Ergo, macro traders could track this front before making moves.
A rally or likely price dump – Which way for LTC?
LTC’s price action chalked an inverse head and shoulders pattern, which may set LTC to rally based on the height from the head to the neckline. Also, a reversal may occur based on the same height.
On the daily chart, the RSI and stochastic RSI retreated – evidence of increased selling pressure. But sellers may cool off if stochastic RSI hits the oversold zone. On the other hand, the OBV (On Balance Volume) has increased since mid-March, indicating genuine demand for LTC.
If the trend persists, LTC could attempt to break above the neckline of $102.58, especially if Bi
Go to Source to See Full Article
Author: Suzuki Shillsalot
Tip BTC Newswire with Cryptocurrency
Donate Bitcoin to BTC Newswire

Donate Bitcoin Cash to BTC Newswire

Donate Ethereum to BTC Newswire

Donate Litecoin to BTC Newswire

Donate Monero to BTC Newswire

Donate ZCash to BTC Newswire


