Disclaimer: The information presented does not constitute financial, investment, trading, or other types of advice and is solely the writer’s opinion.
- Litecoin price action showed a move below $80 could be followed by an extended downtrend.
- The on-chain metrics painted a hopeful picture for the beleaguered bulls.
Litecoin [LTC] saw a strong pump in late June. The price gained 41% within a week as LTC surged from $81 to $115. But July and August saw bearish pressure begin to dominate. At the time of writing, LTC was trading at a vital support zone.
Is your portfolio green? Check the Litecoin Profit Calculator
Any further losses for LTC would flip its higher timeframe bias bearish. The decrease in hash rate on the network after the Litecoin halving event was a cause for concern. The downtrend in prices after the halving showed that a repeat of 2019 was a possibility.
The bullish order block presented a chance for buyers to redeem themselves
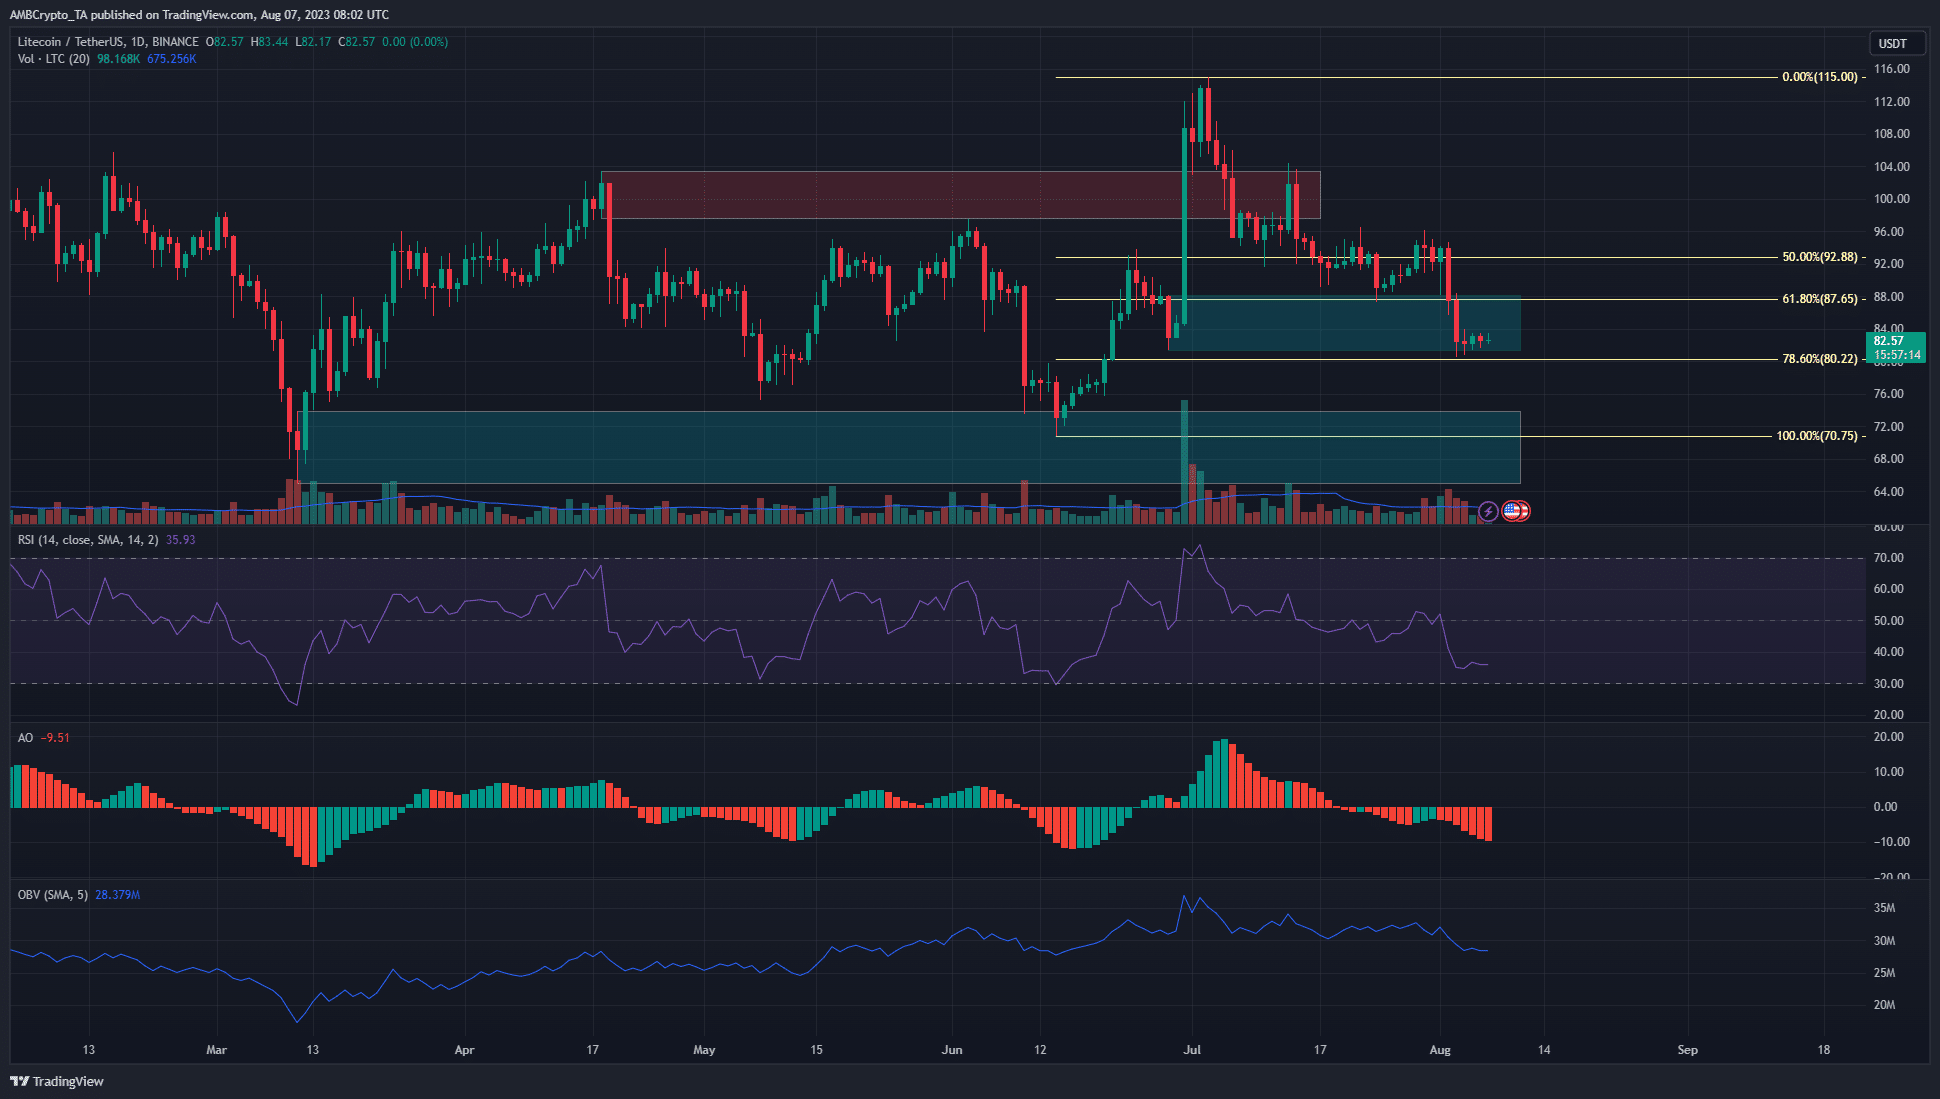
On the 1-day price chart, the RSI was below neutral 50 since 15 July, showing bearish momentum. The Awesome Oscillator made a bearish crossover on 20 July, reinforcing the finding from the RSI. The OBV began to slide lower in August to highlight increased selling pressure.
The price action showed the market structure was bearish after the fall below $91.6. The subsequent retest of the $100 resistance zone and rejection showed bears had the upper hand. At the time of writing, LTC sunk to the bullish order block at $81.4-$88, highlighted in cyan.
The 78.6% Fibonacci retracement level (yellow) was close by. Together, these factors underlined that LTC bulls must defend the $80 area and drive prices higher. If they fail to do so, further losses were lik
Go to Source to See Full Article
Author: Akashnath S
Tip BTC Newswire with Cryptocurrency
Donate Bitcoin to BTC Newswire

Donate Bitcoin Cash to BTC Newswire

Donate Ethereum to BTC Newswire

Donate Litecoin to BTC Newswire

Donate Monero to BTC Newswire

Donate ZCash to BTC Newswire


